Happy early Memorial Day! We hope you get to spend some time with family and friends over the long upcoming weekend.
Markets & Economy
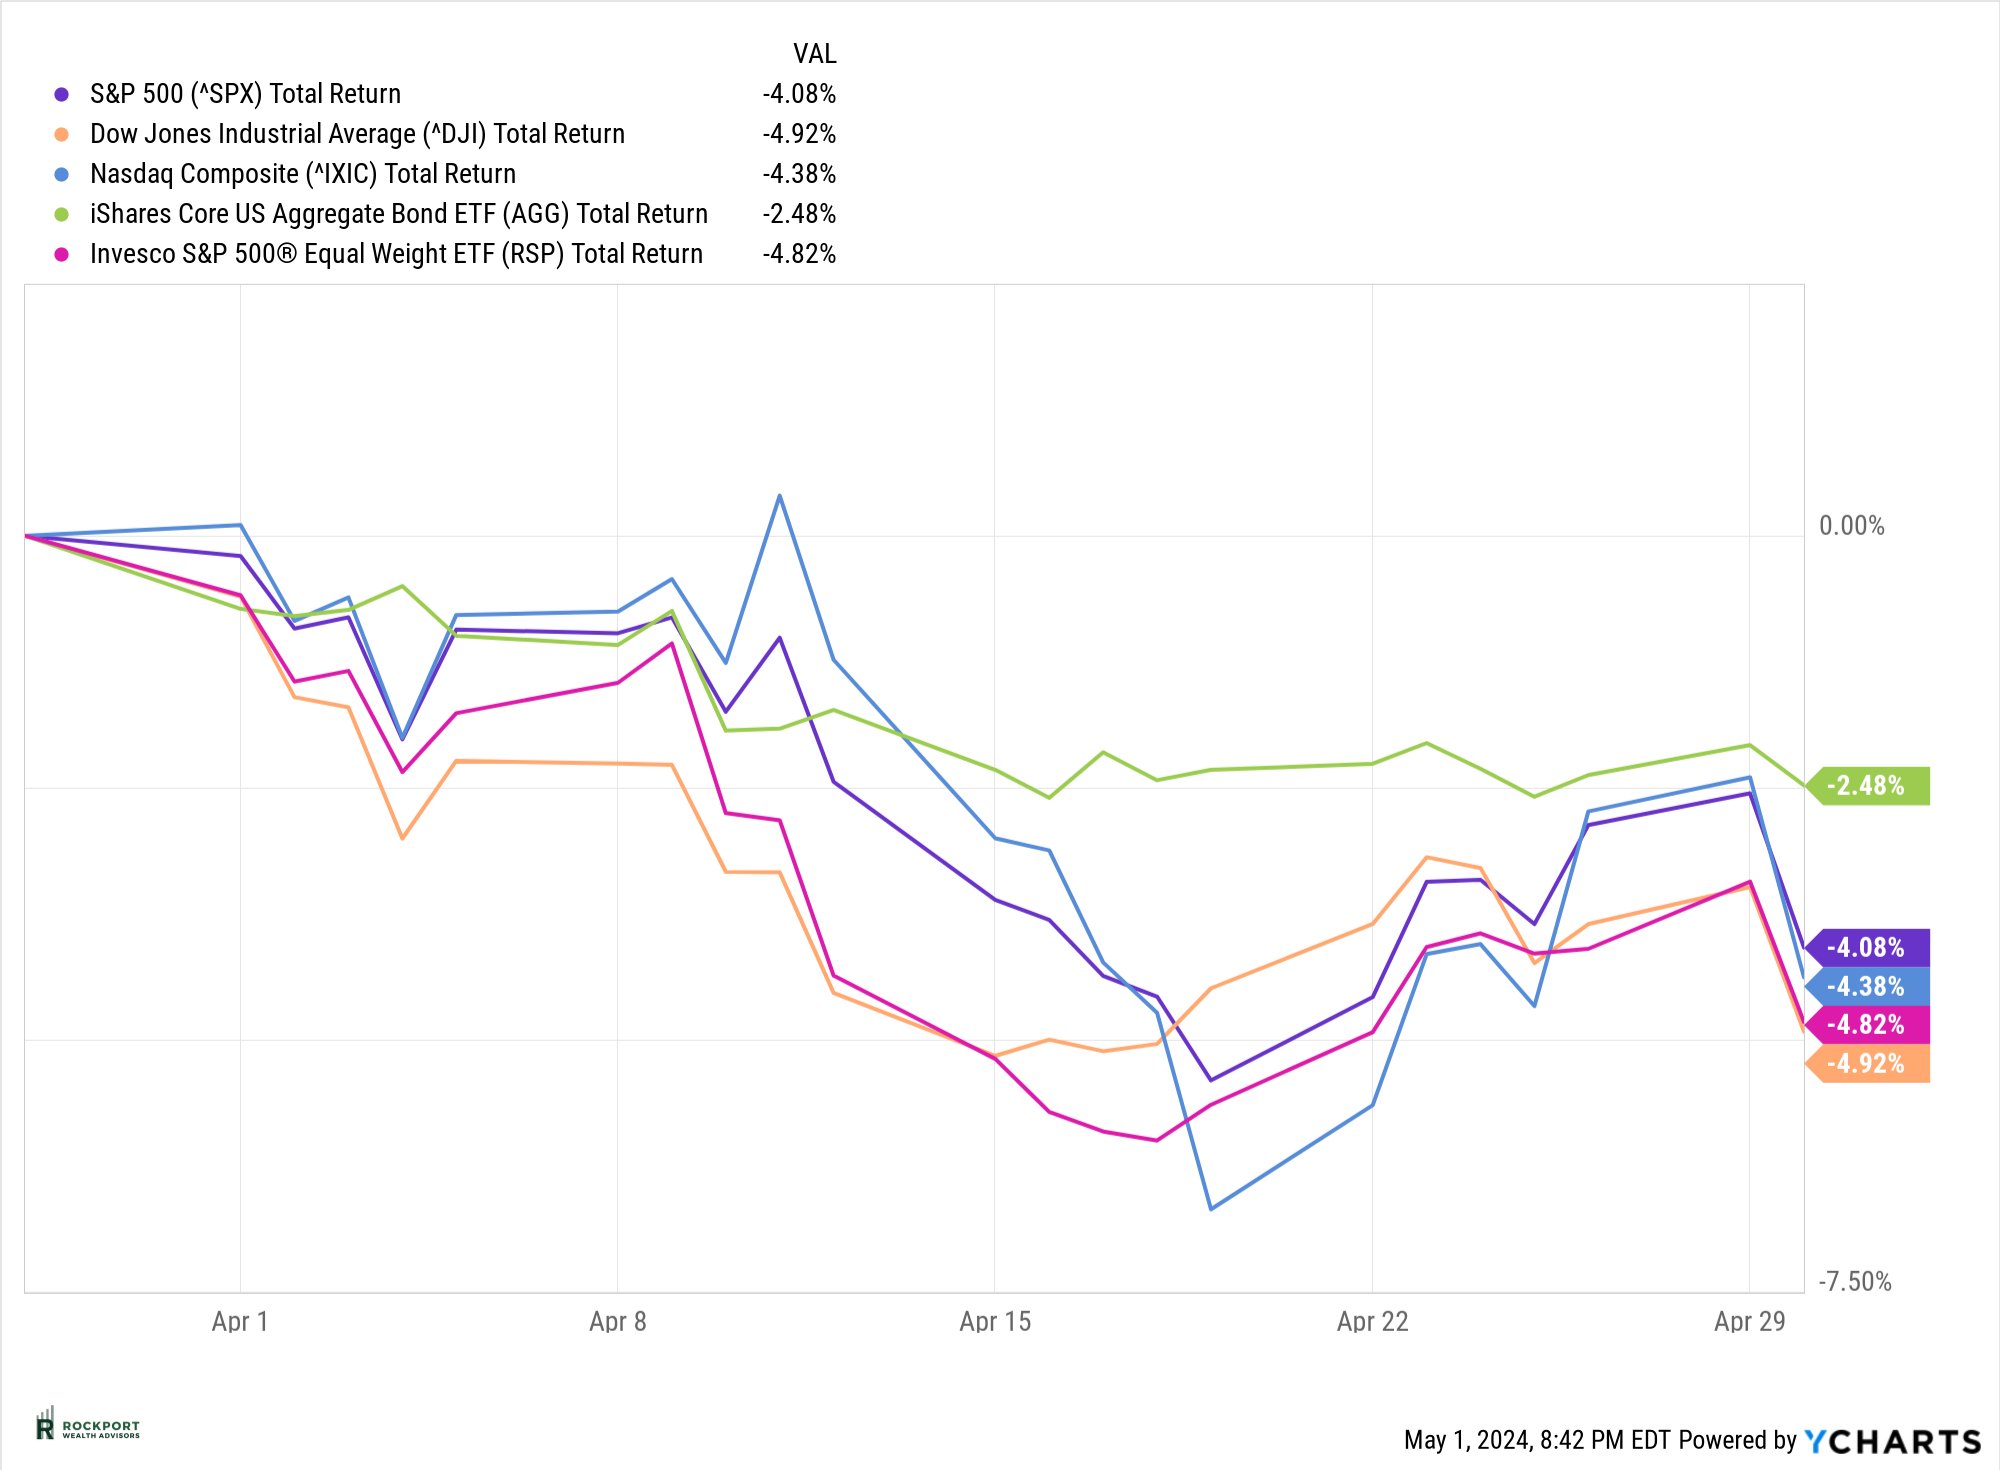
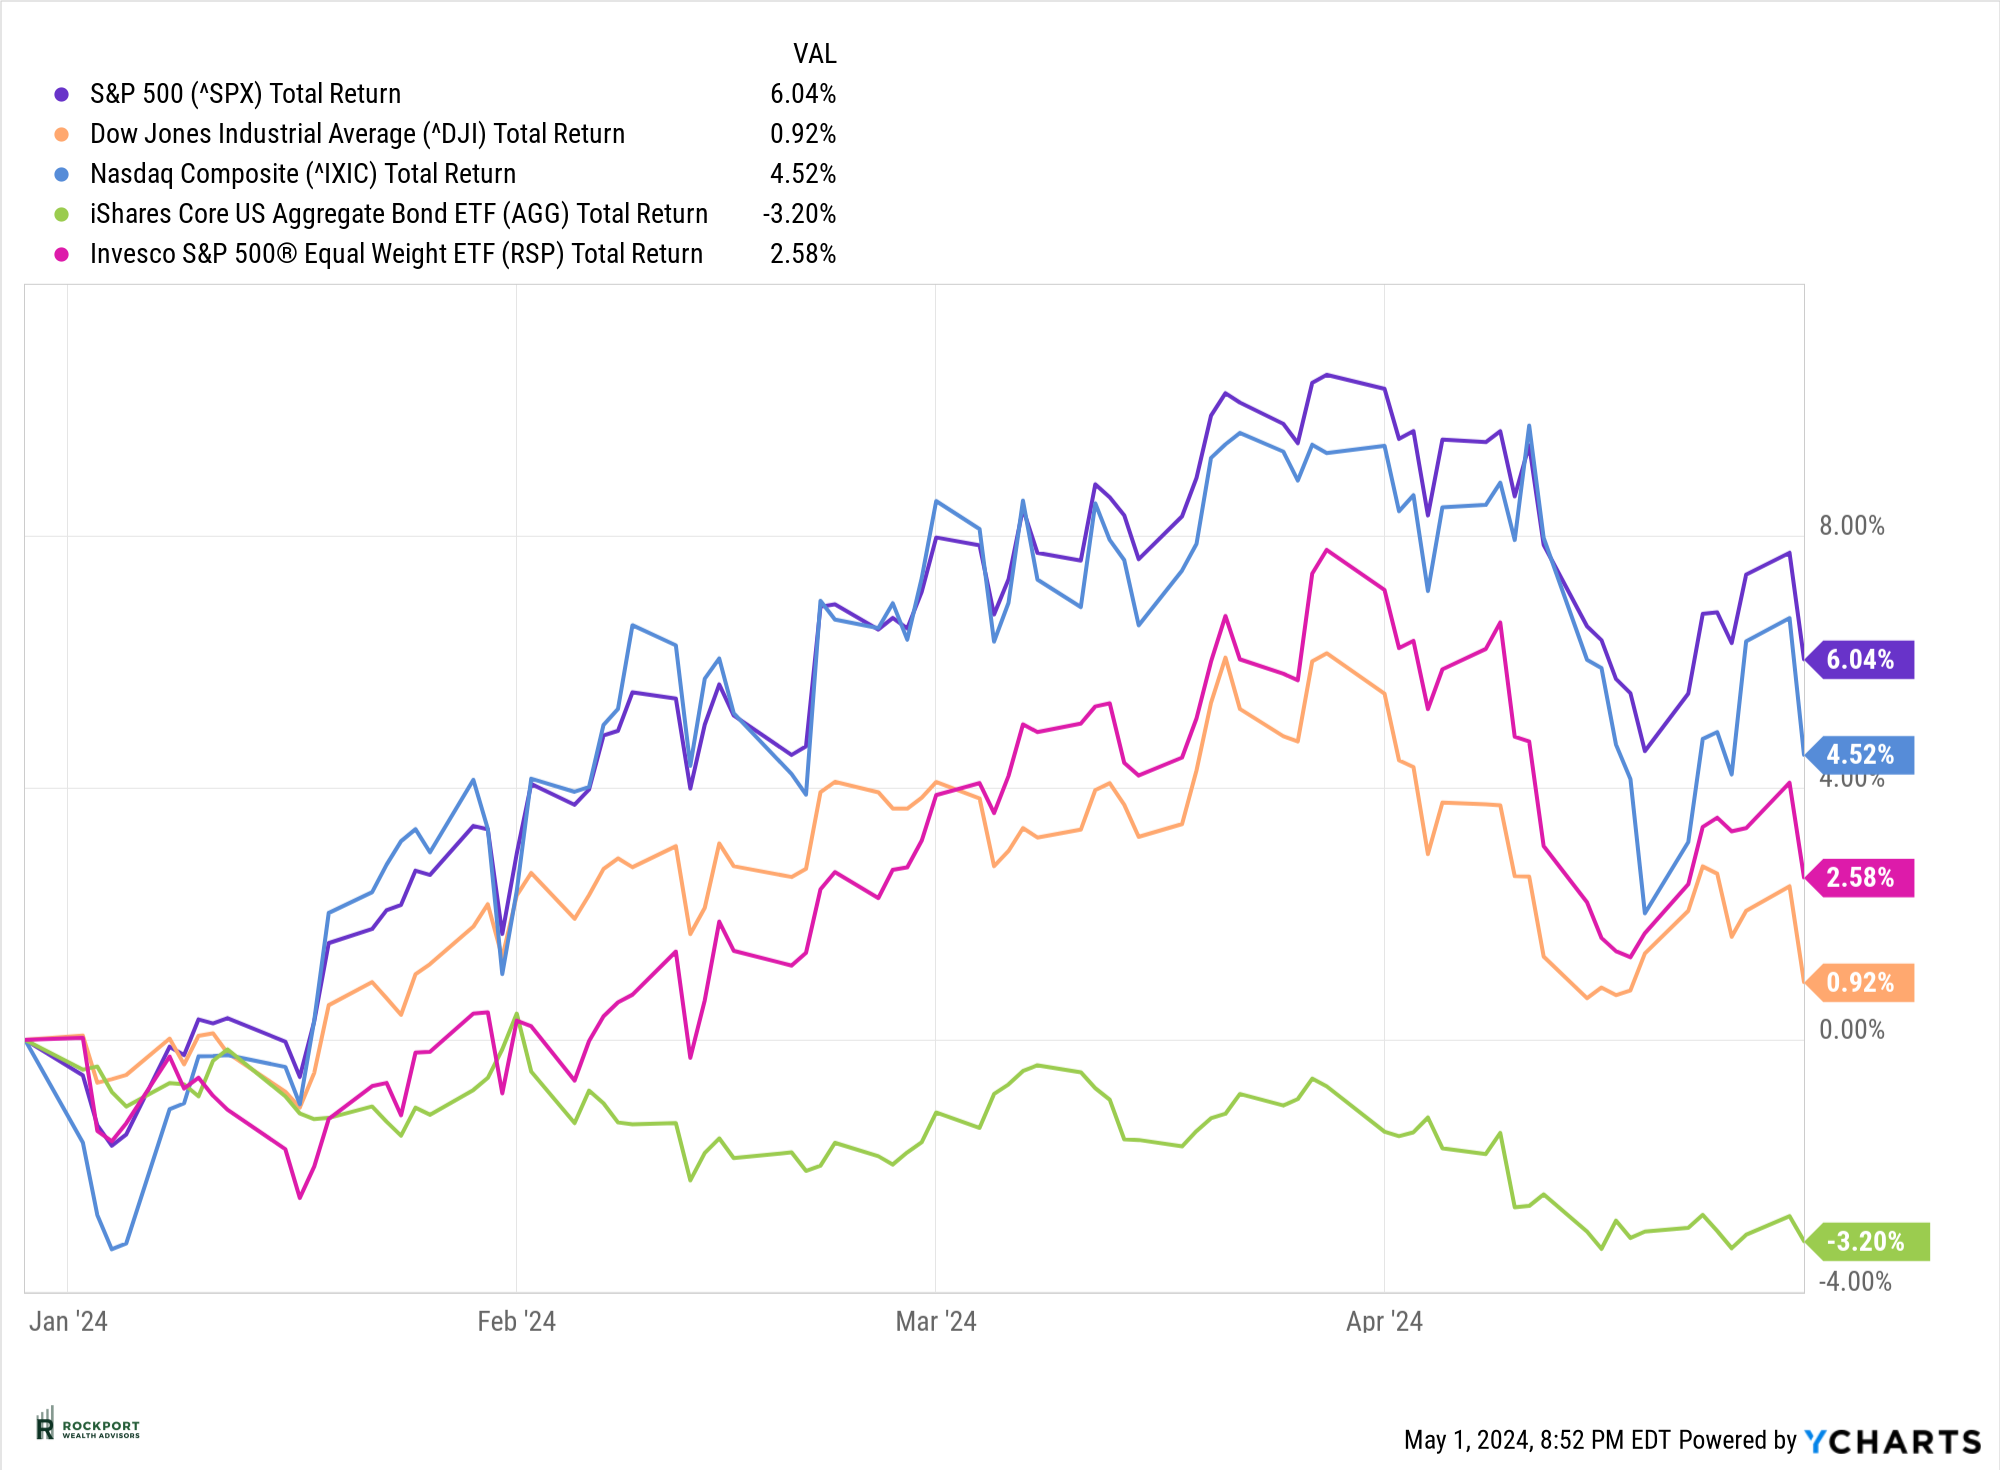
April brought a notable shift in the markets as they took their first breather of the year. The S&P 500 declined by 4.08% for the month, yet it remains positive with a 6.04% gain year-to-date. At one point in April, the decline exceeded 5%. It’s important to understand that 5% pullbacks in markets happen several times a year, so this is not an uncommon occurrence.
Moreover, the average decline in a calendar year typically ranges from 13-14%, making this particular dip quite mild in comparison. Considering the markets’ resilience since October 2023, this downturn was not unexpected. Expecting the markets to maintain their pace of the past six months would have been unrealistic.
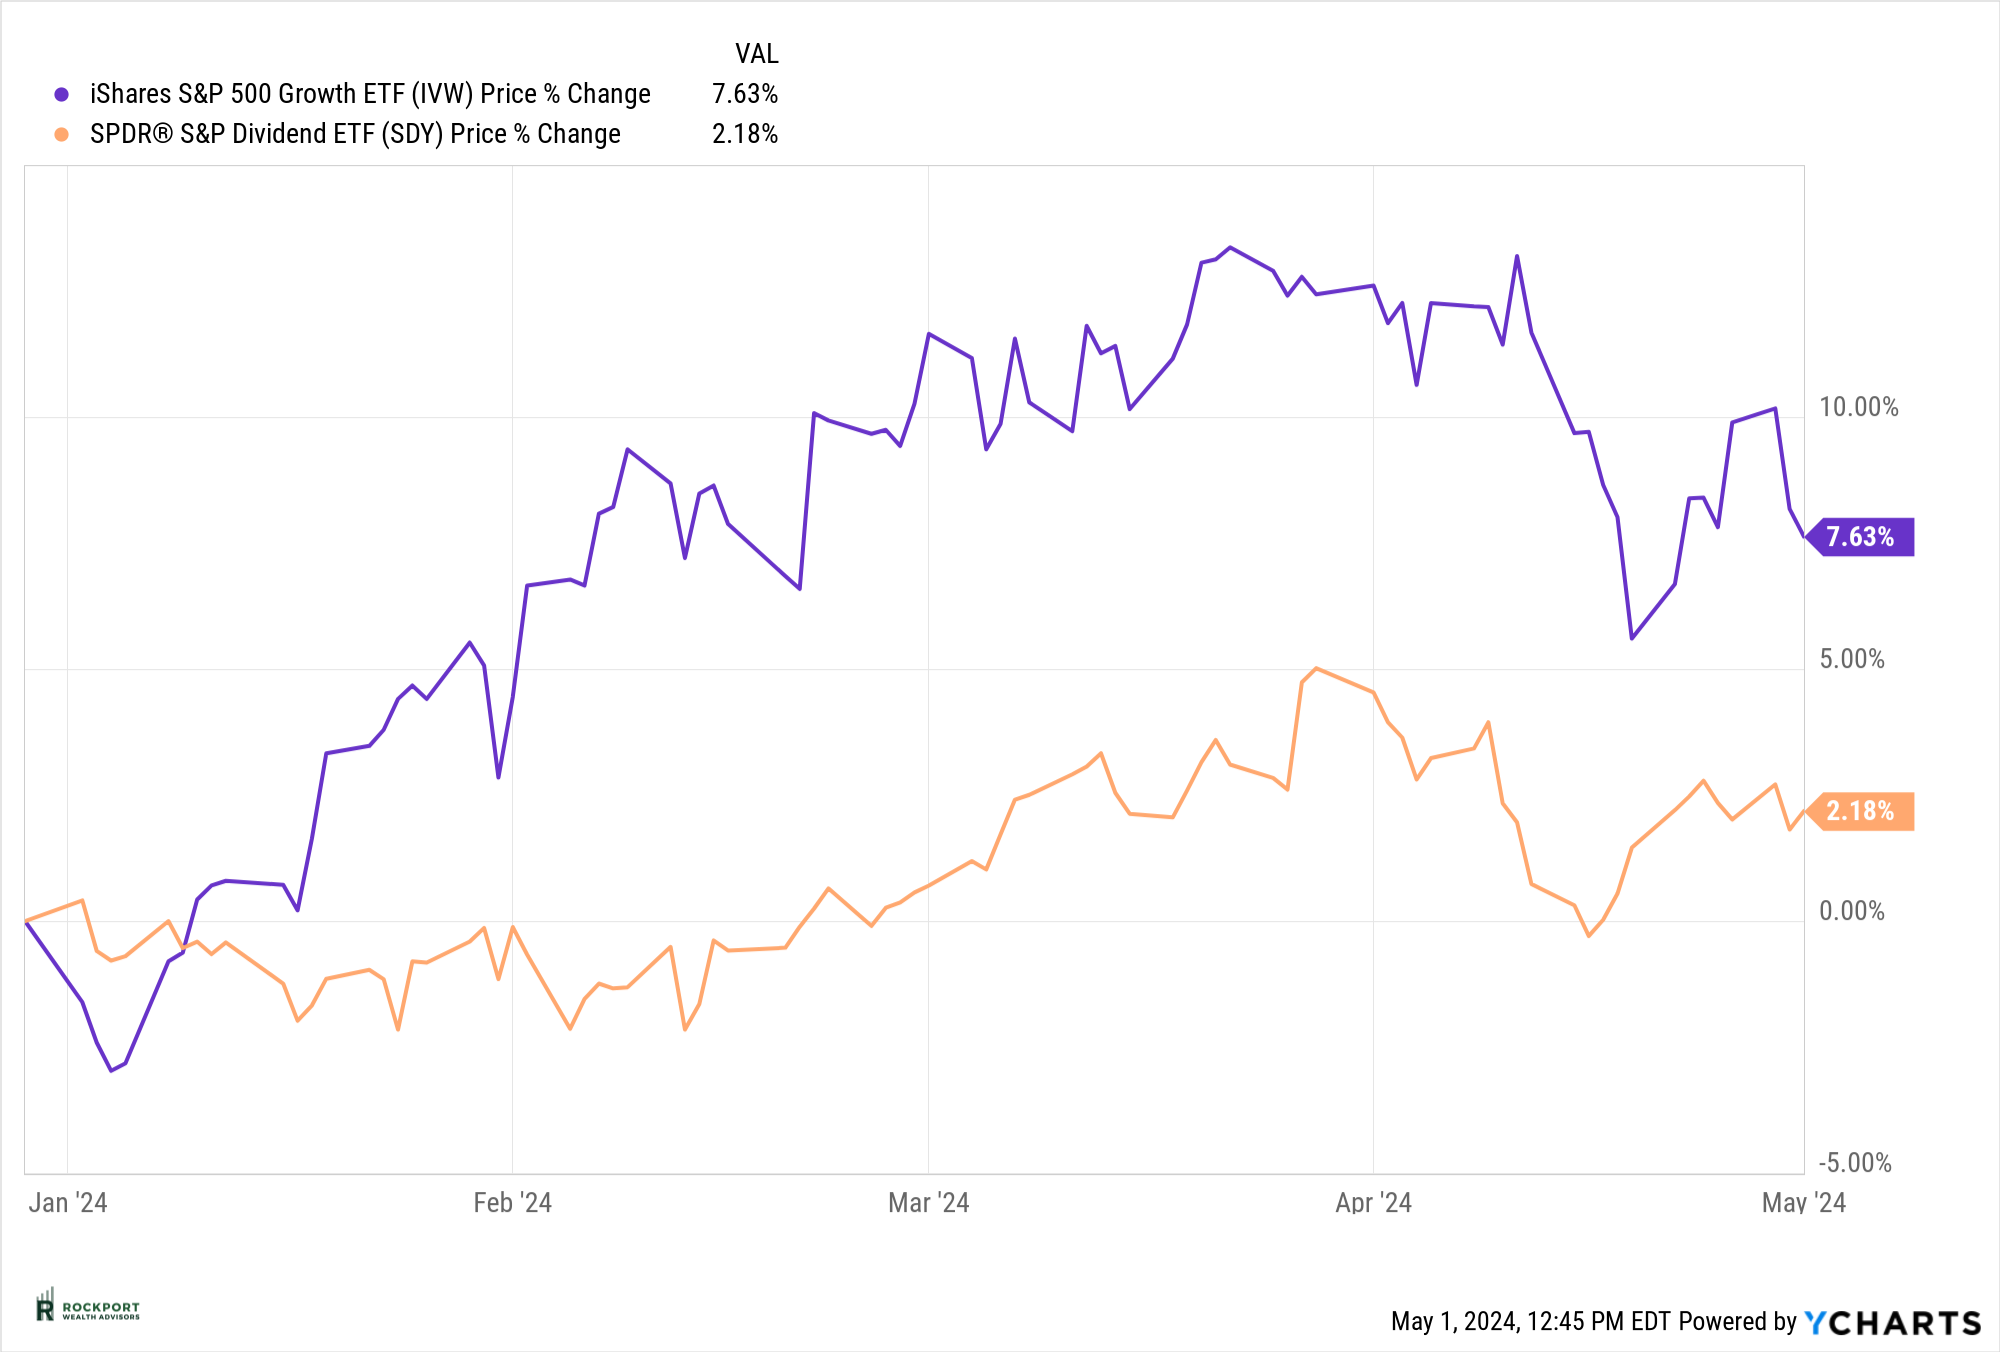
As for the remainder of our closely watched indicators, there are some subtle changes but nothing major although many trends still continue.
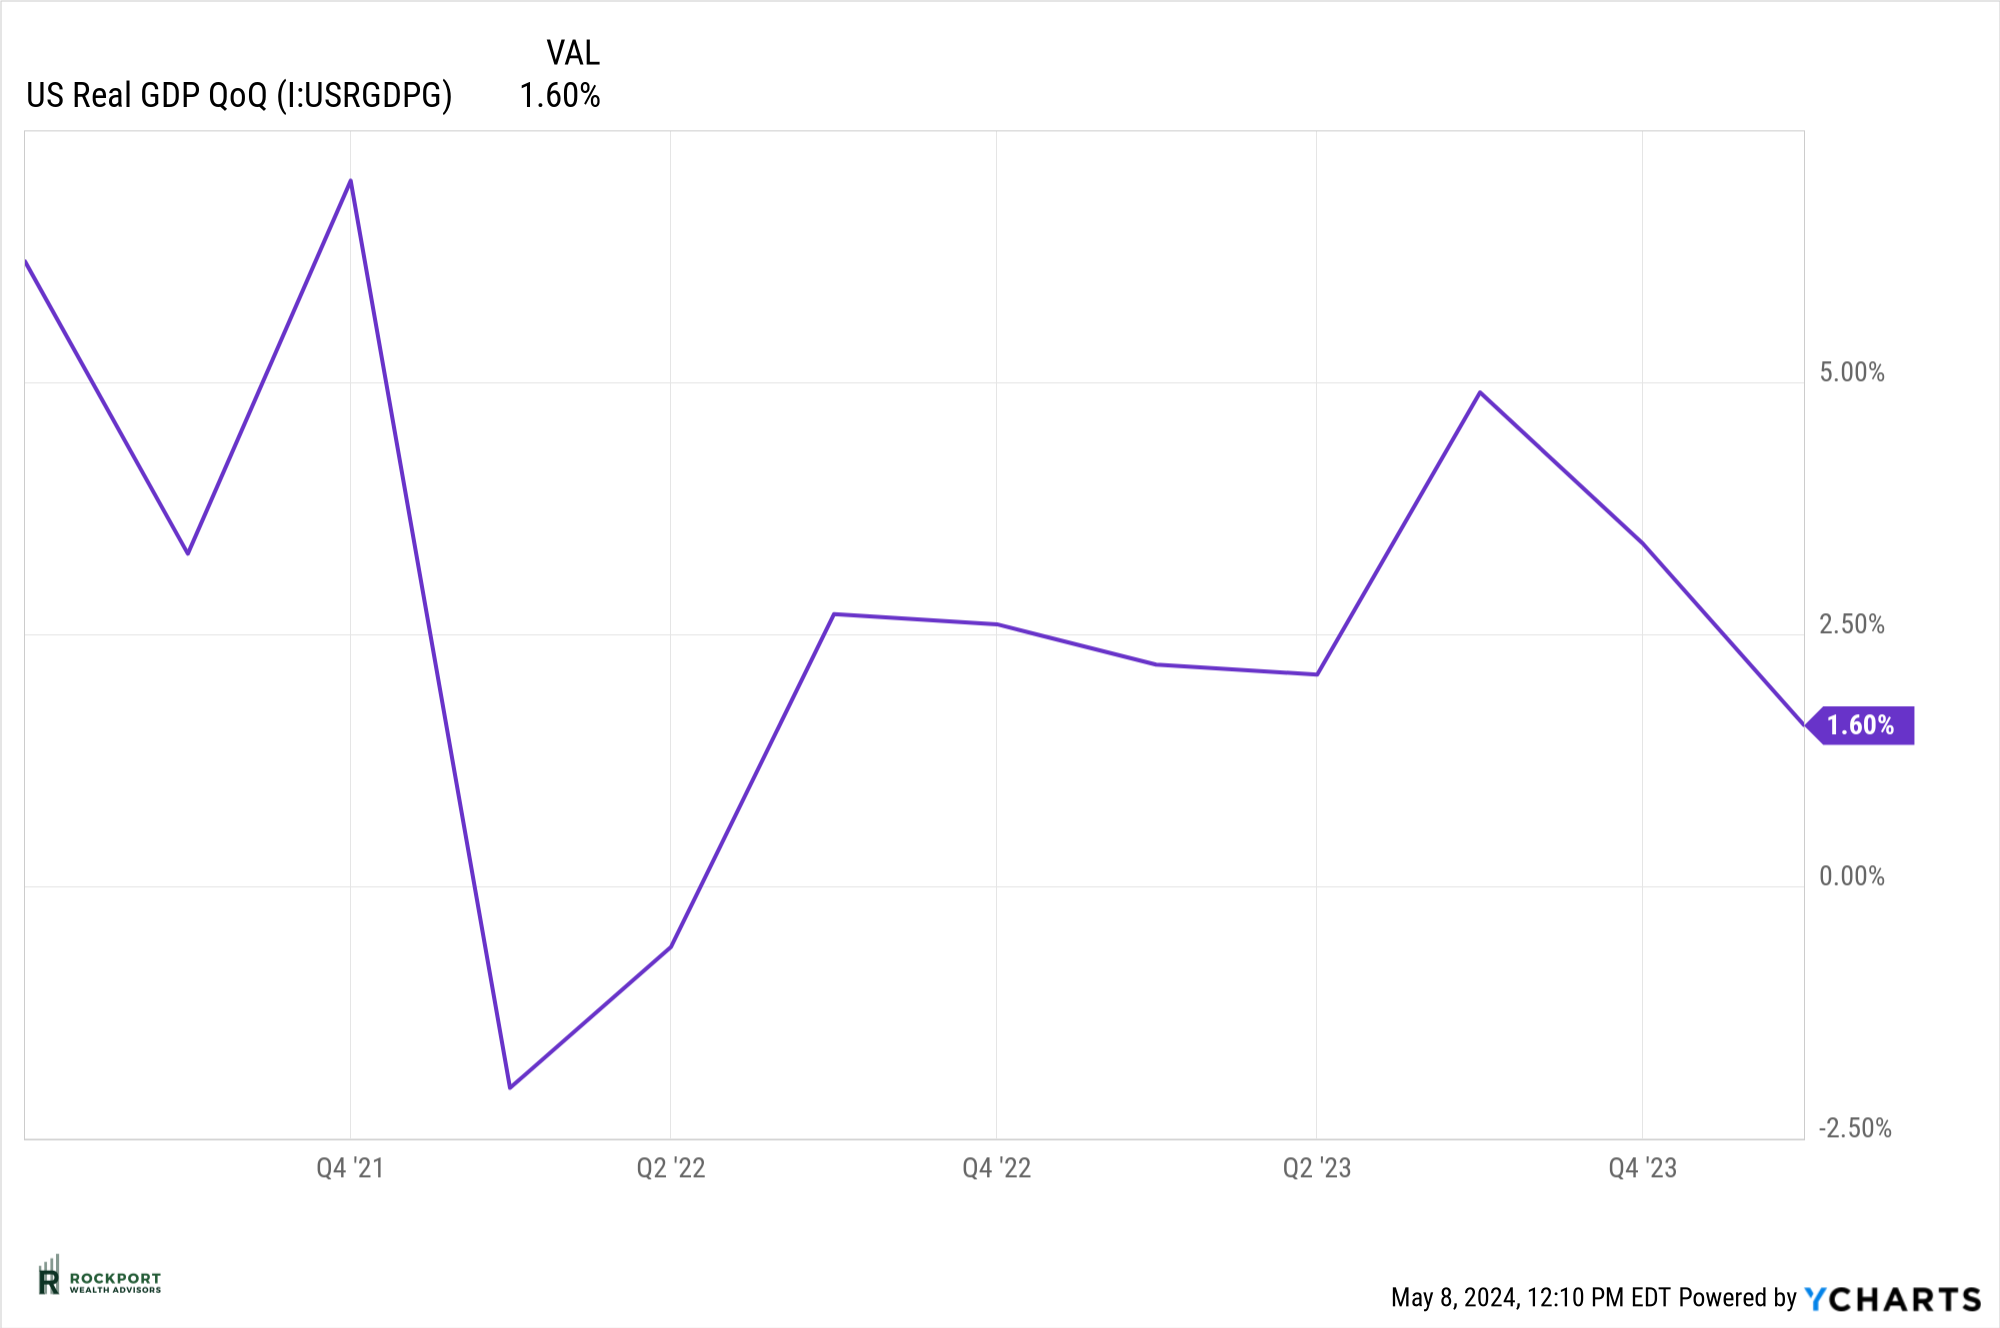
The standout news of the month centered around Gross Domestic Product (GDP). U.S. GDP unexpectedly dropped to 1.6% from 4.9% in the fourth quarter of 2023. This development underscores a slowing economy and warrants close attention.
Historically, a recession is defined as two consecutive quarters of negative GDP growth. While we have been monitoring this closely, it has not been a focal point in our newsletter. However, moving forward, we will provide regular updates on this important indicator. Please note that GDP data is updated quarterly, with the next reading expected in July.
University of Michigan Consumer Confidence has continued to nudge higher. This is good and falls into the recession less likely camp if the trend continues.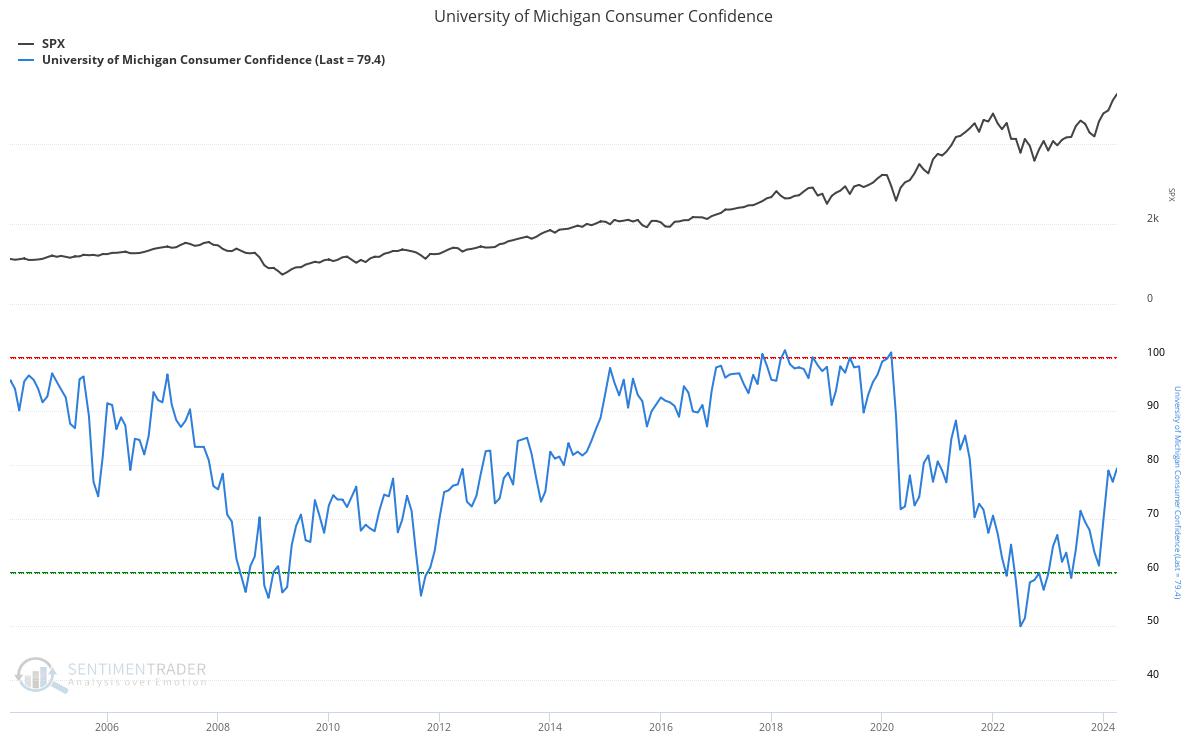
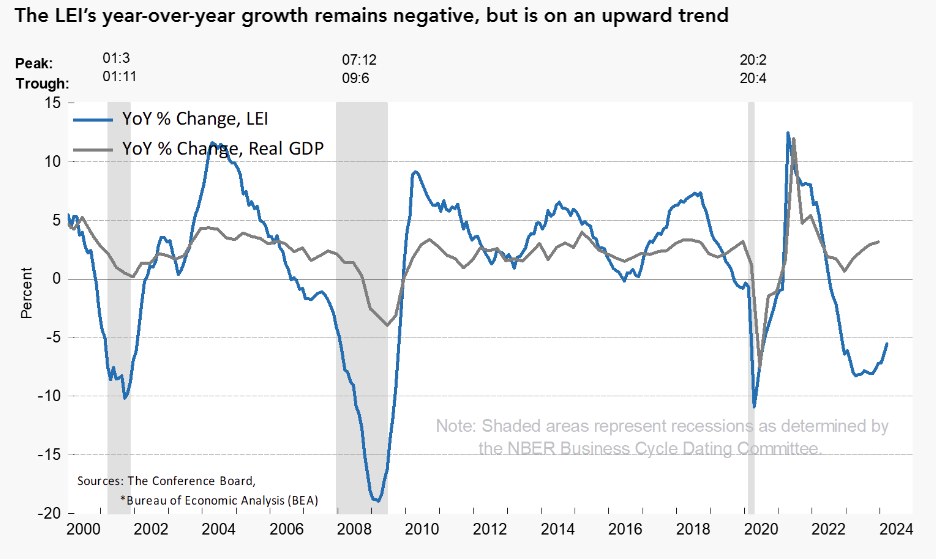
The US Leading Economic Index was down .3% from the previous month. This was particularly disappointing after last month’s brief improvement that was the only increase in the past 25 months. However, the 6-month growth rate has improved which is slightly encouraging. We still remain concerned about this trend overall.
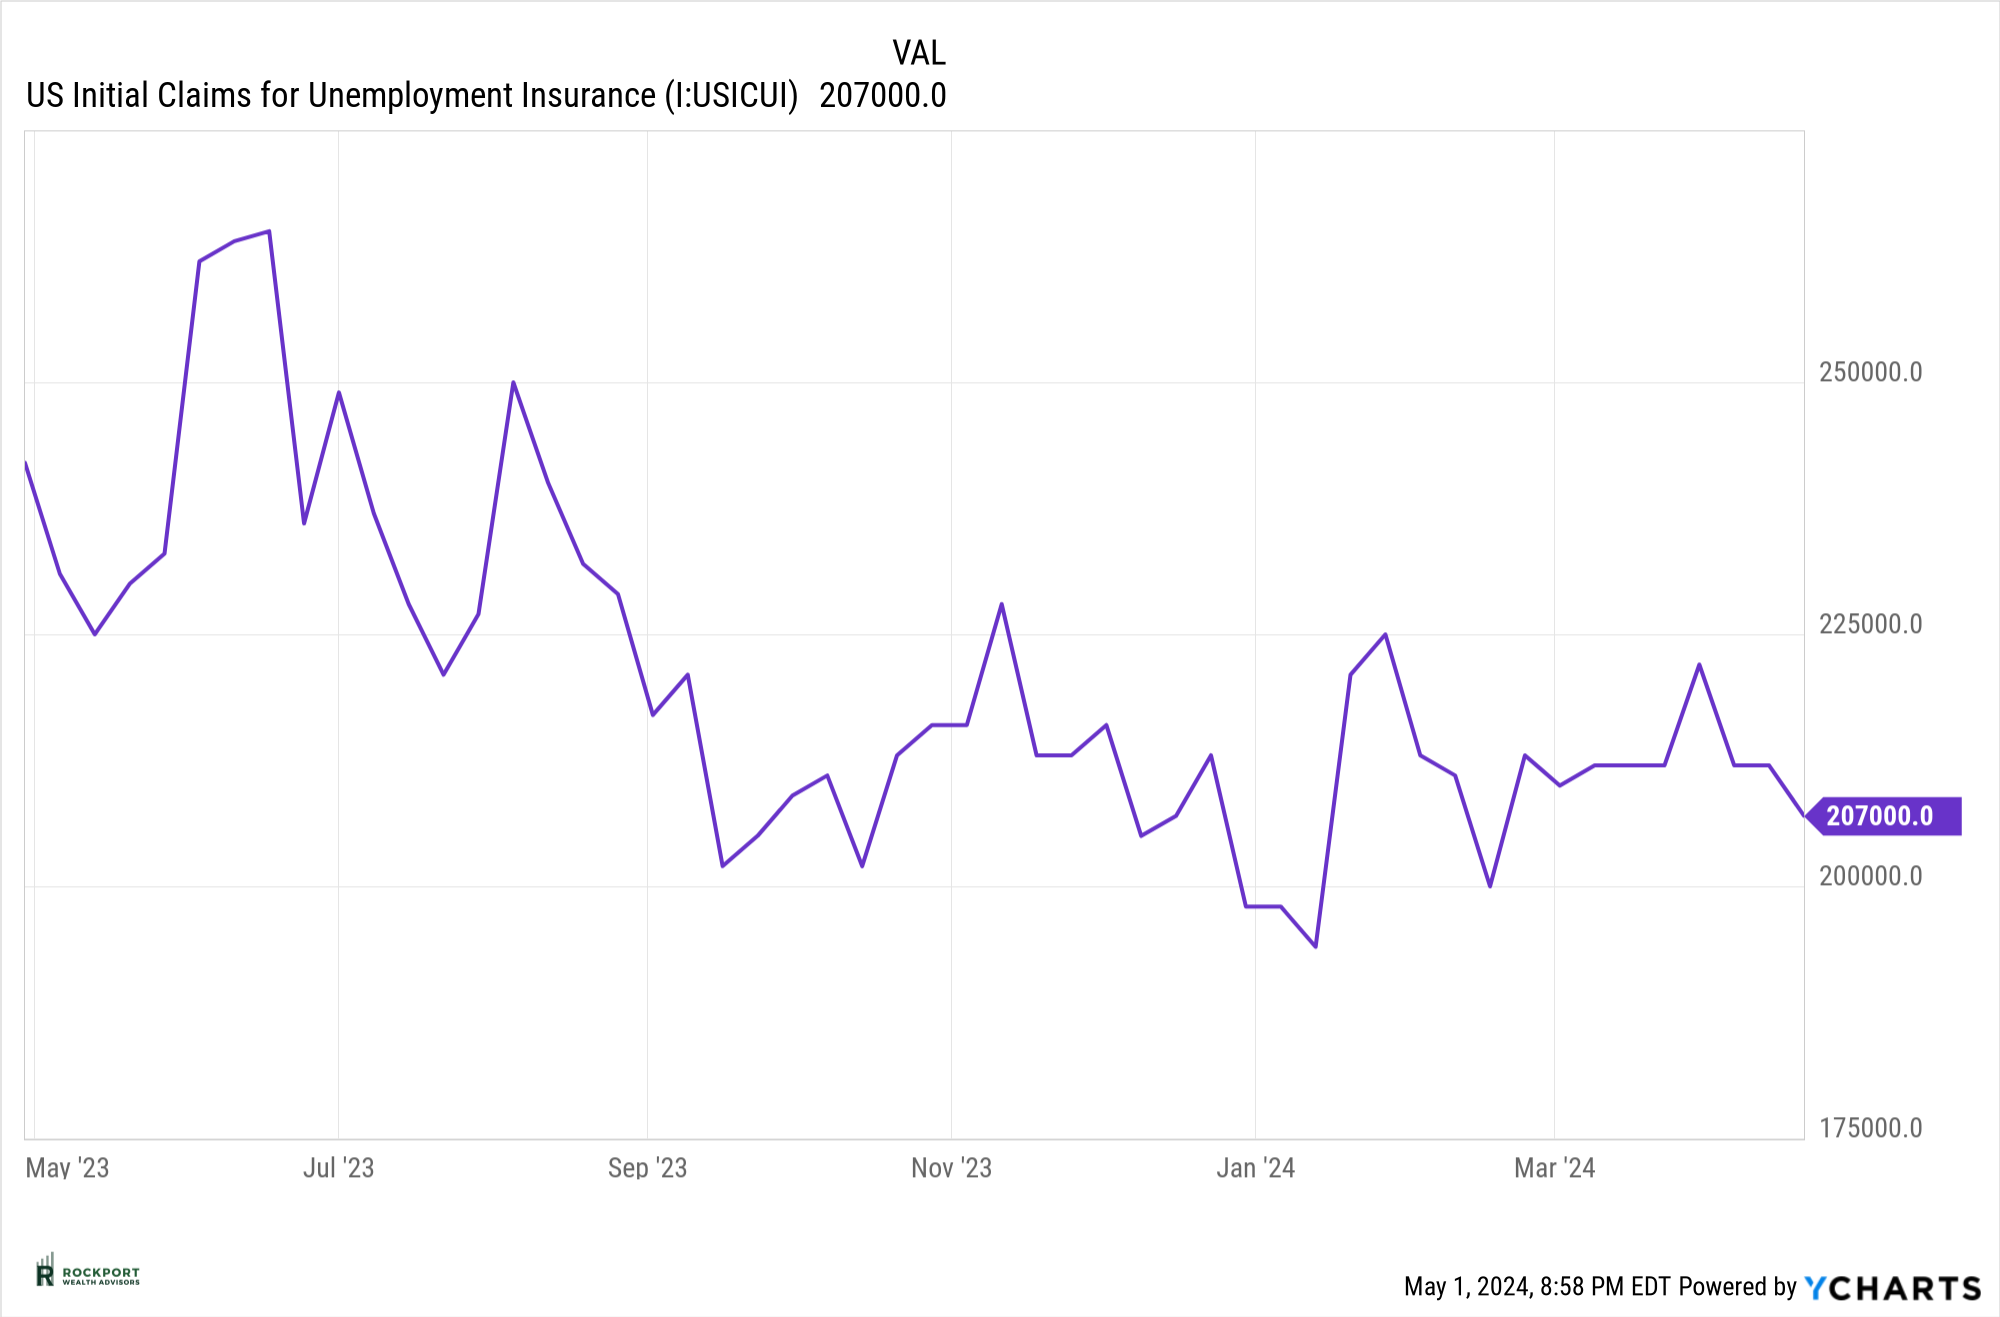
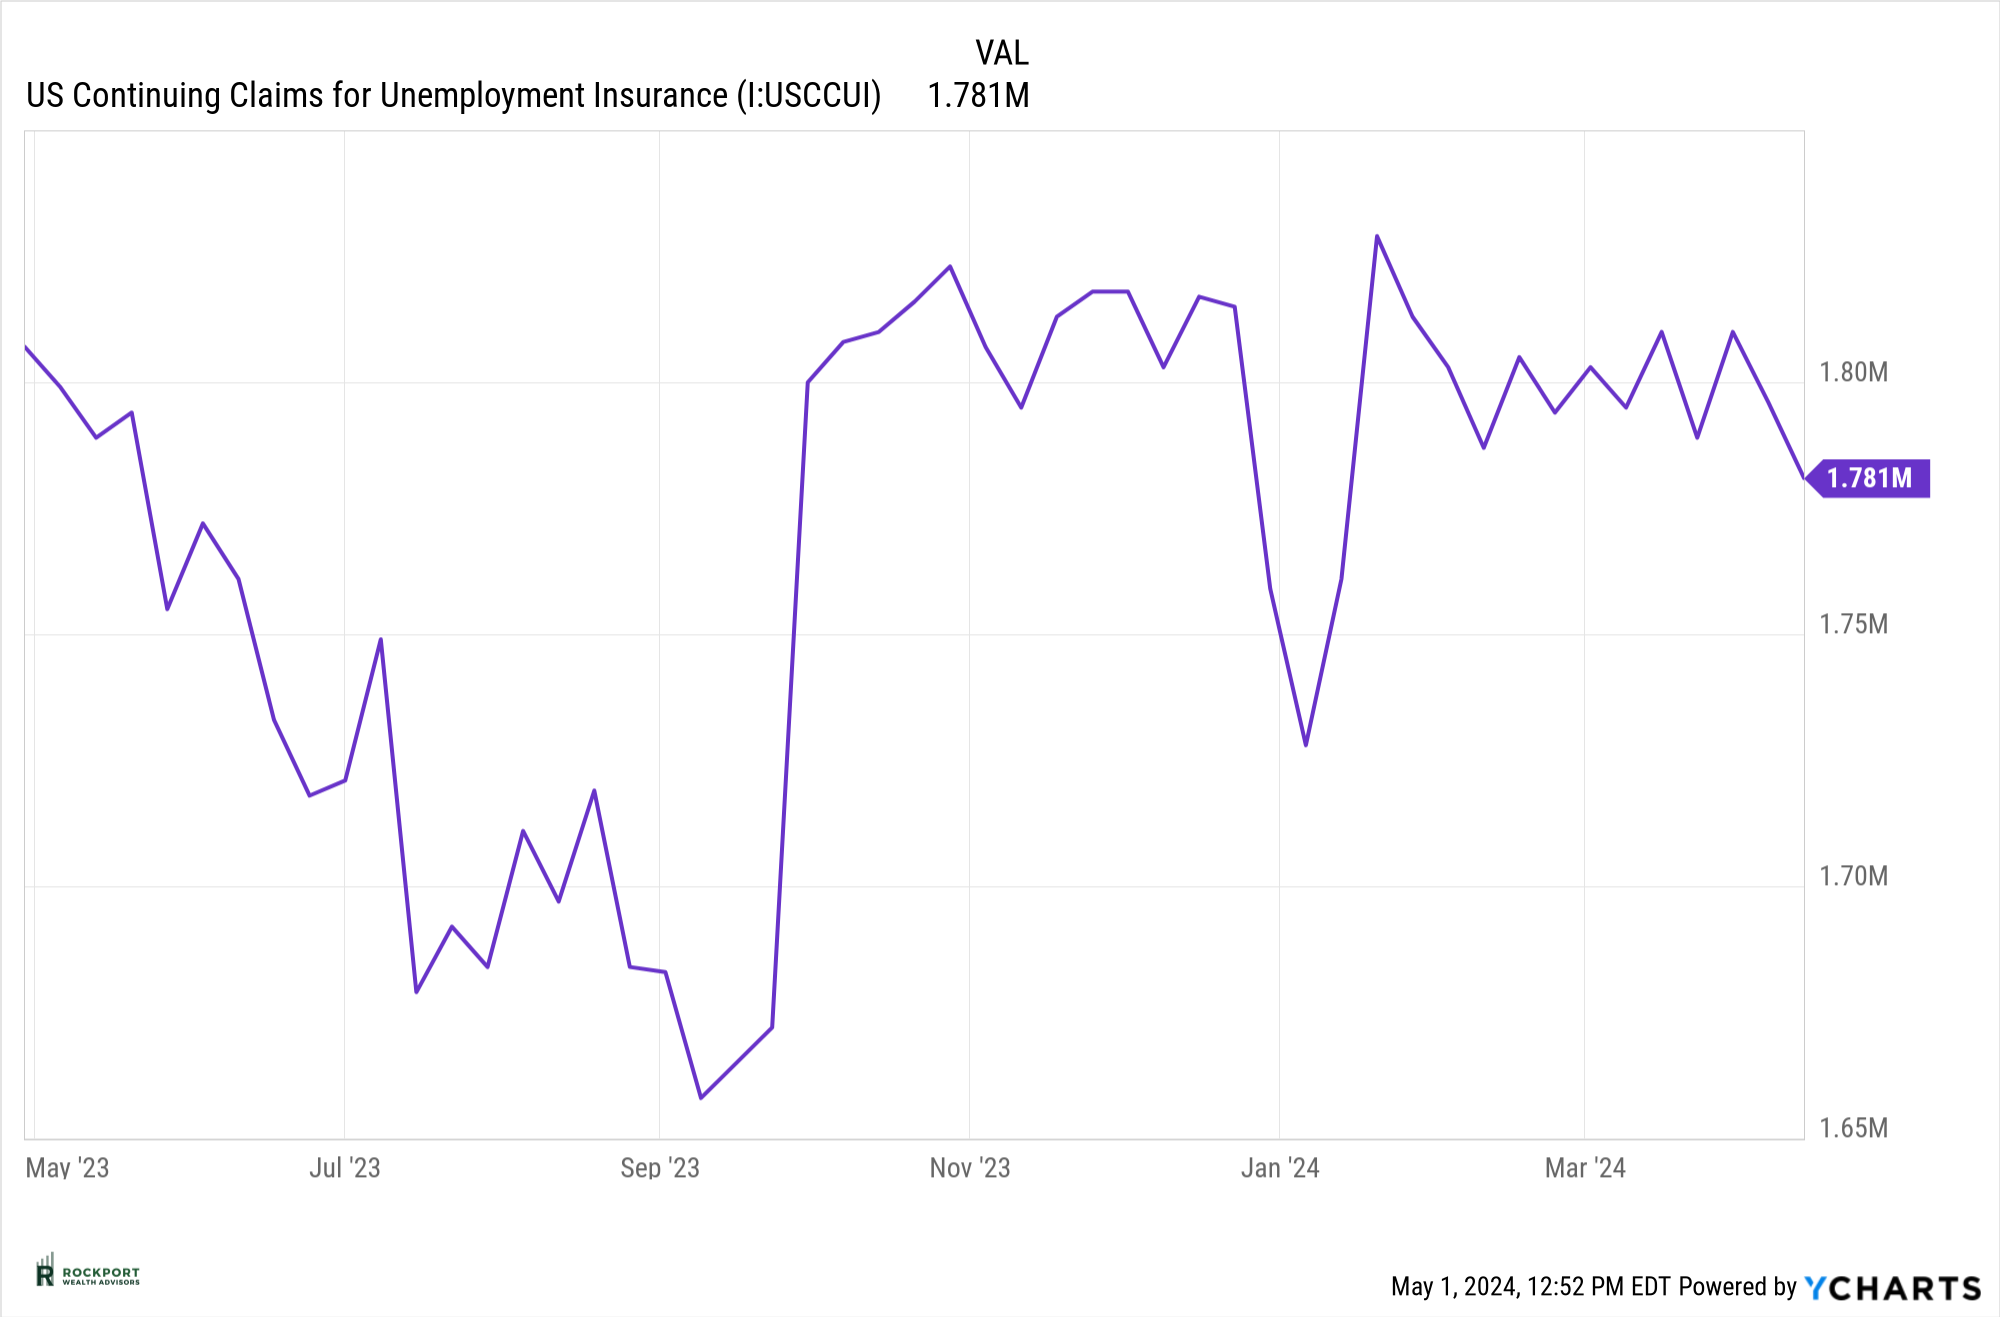
Both initial and continuing unemployment claims moved down slightly this past month although skepticism seems to surround these numbers in terms of how they are being calculated. Taken at face value this is good and the employment picture remains strong.
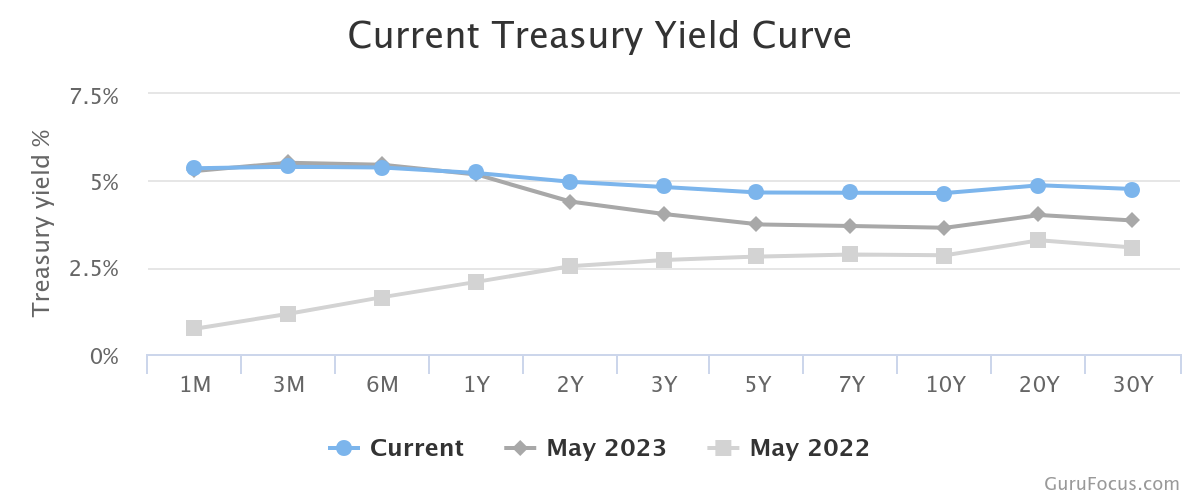
The yield curve has been in an inverted status since July 2022. This is a near record in terms of length of time of the conversion. As stated previously this particular indicator has a very good track record of predicting recessions. According to our findings there has only been 3 other times this has happened for this long. Unfortunately, all 3 did not end well.
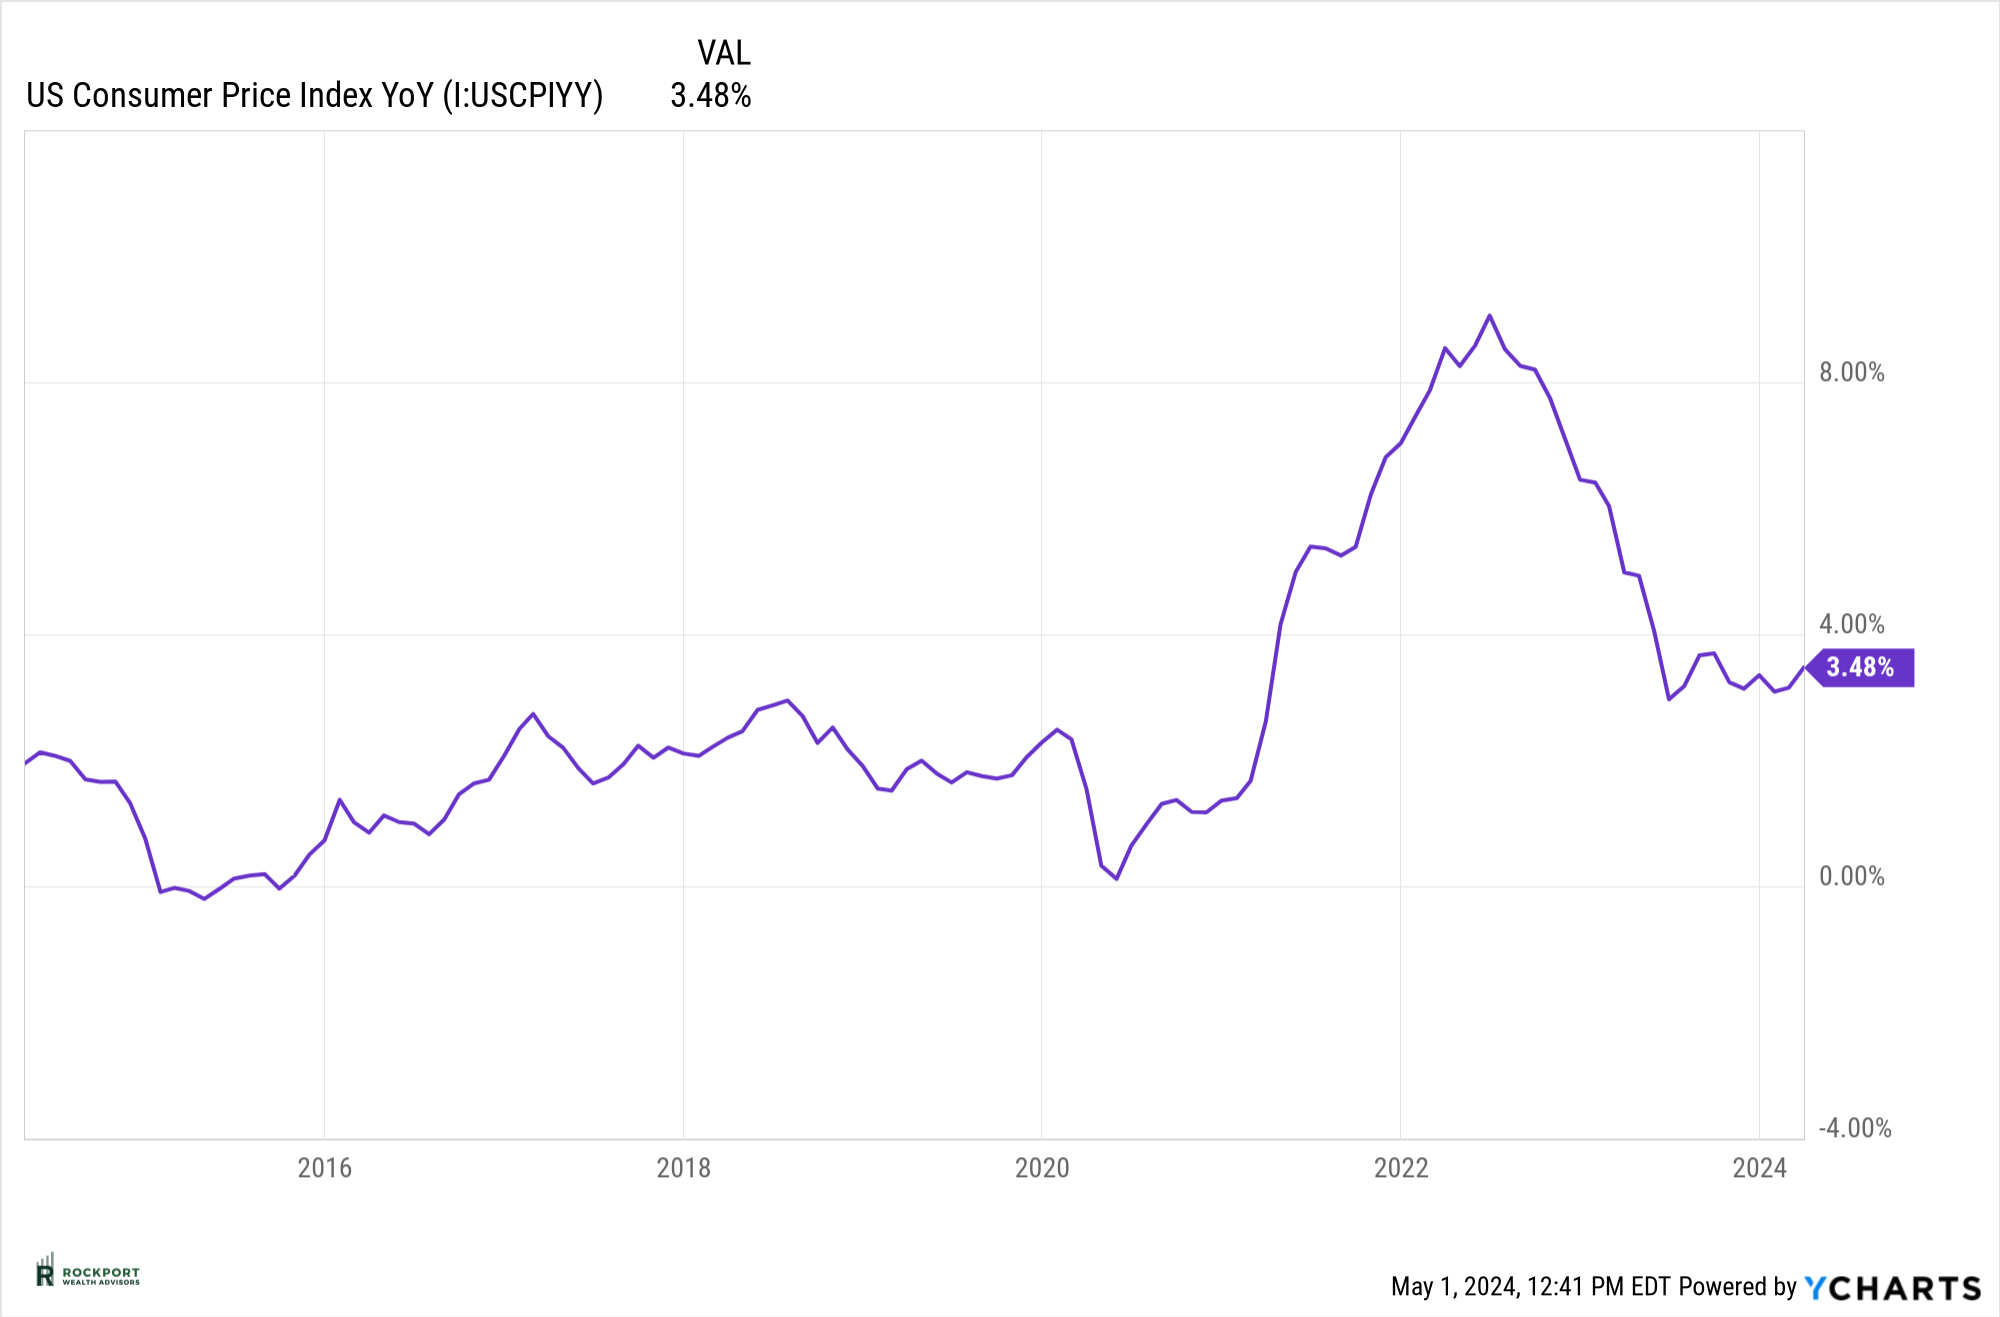
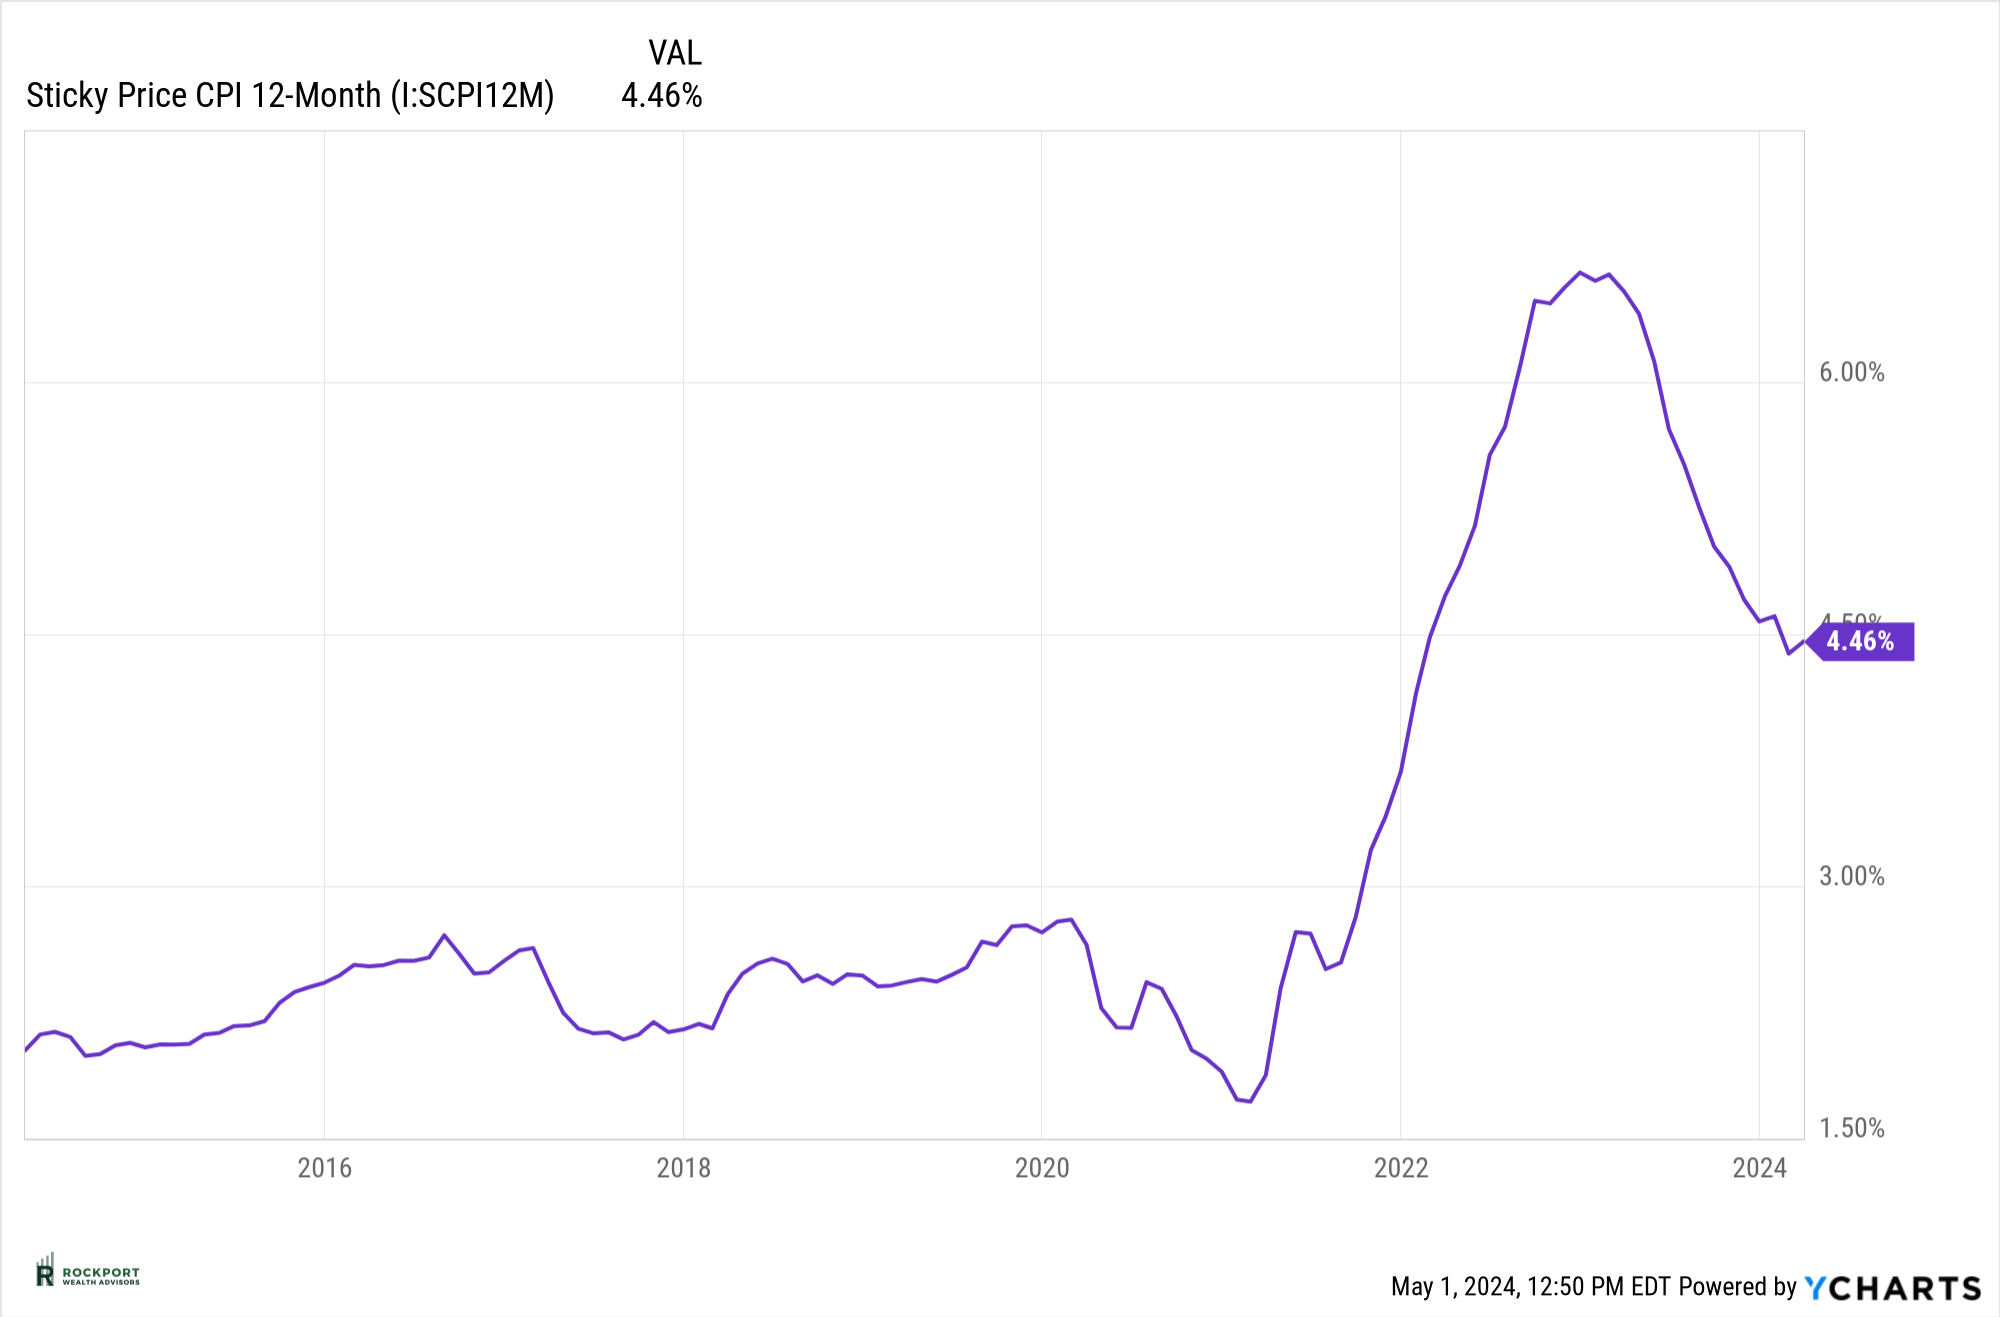
Both CPI and Sticky CPI moved higher. As previously mentioned, many times this is not what the Federal Reserve wants to see right now. This is also the reason that the talk of interest rate cuts which was so prevalent early in the year has backed off. At present futures markets indicate the possibility of 1 interest rate cut in 2024 and a remote possibility of 2 cuts. Keep in mind cutting interest rates only adds to the inflation problem over time.
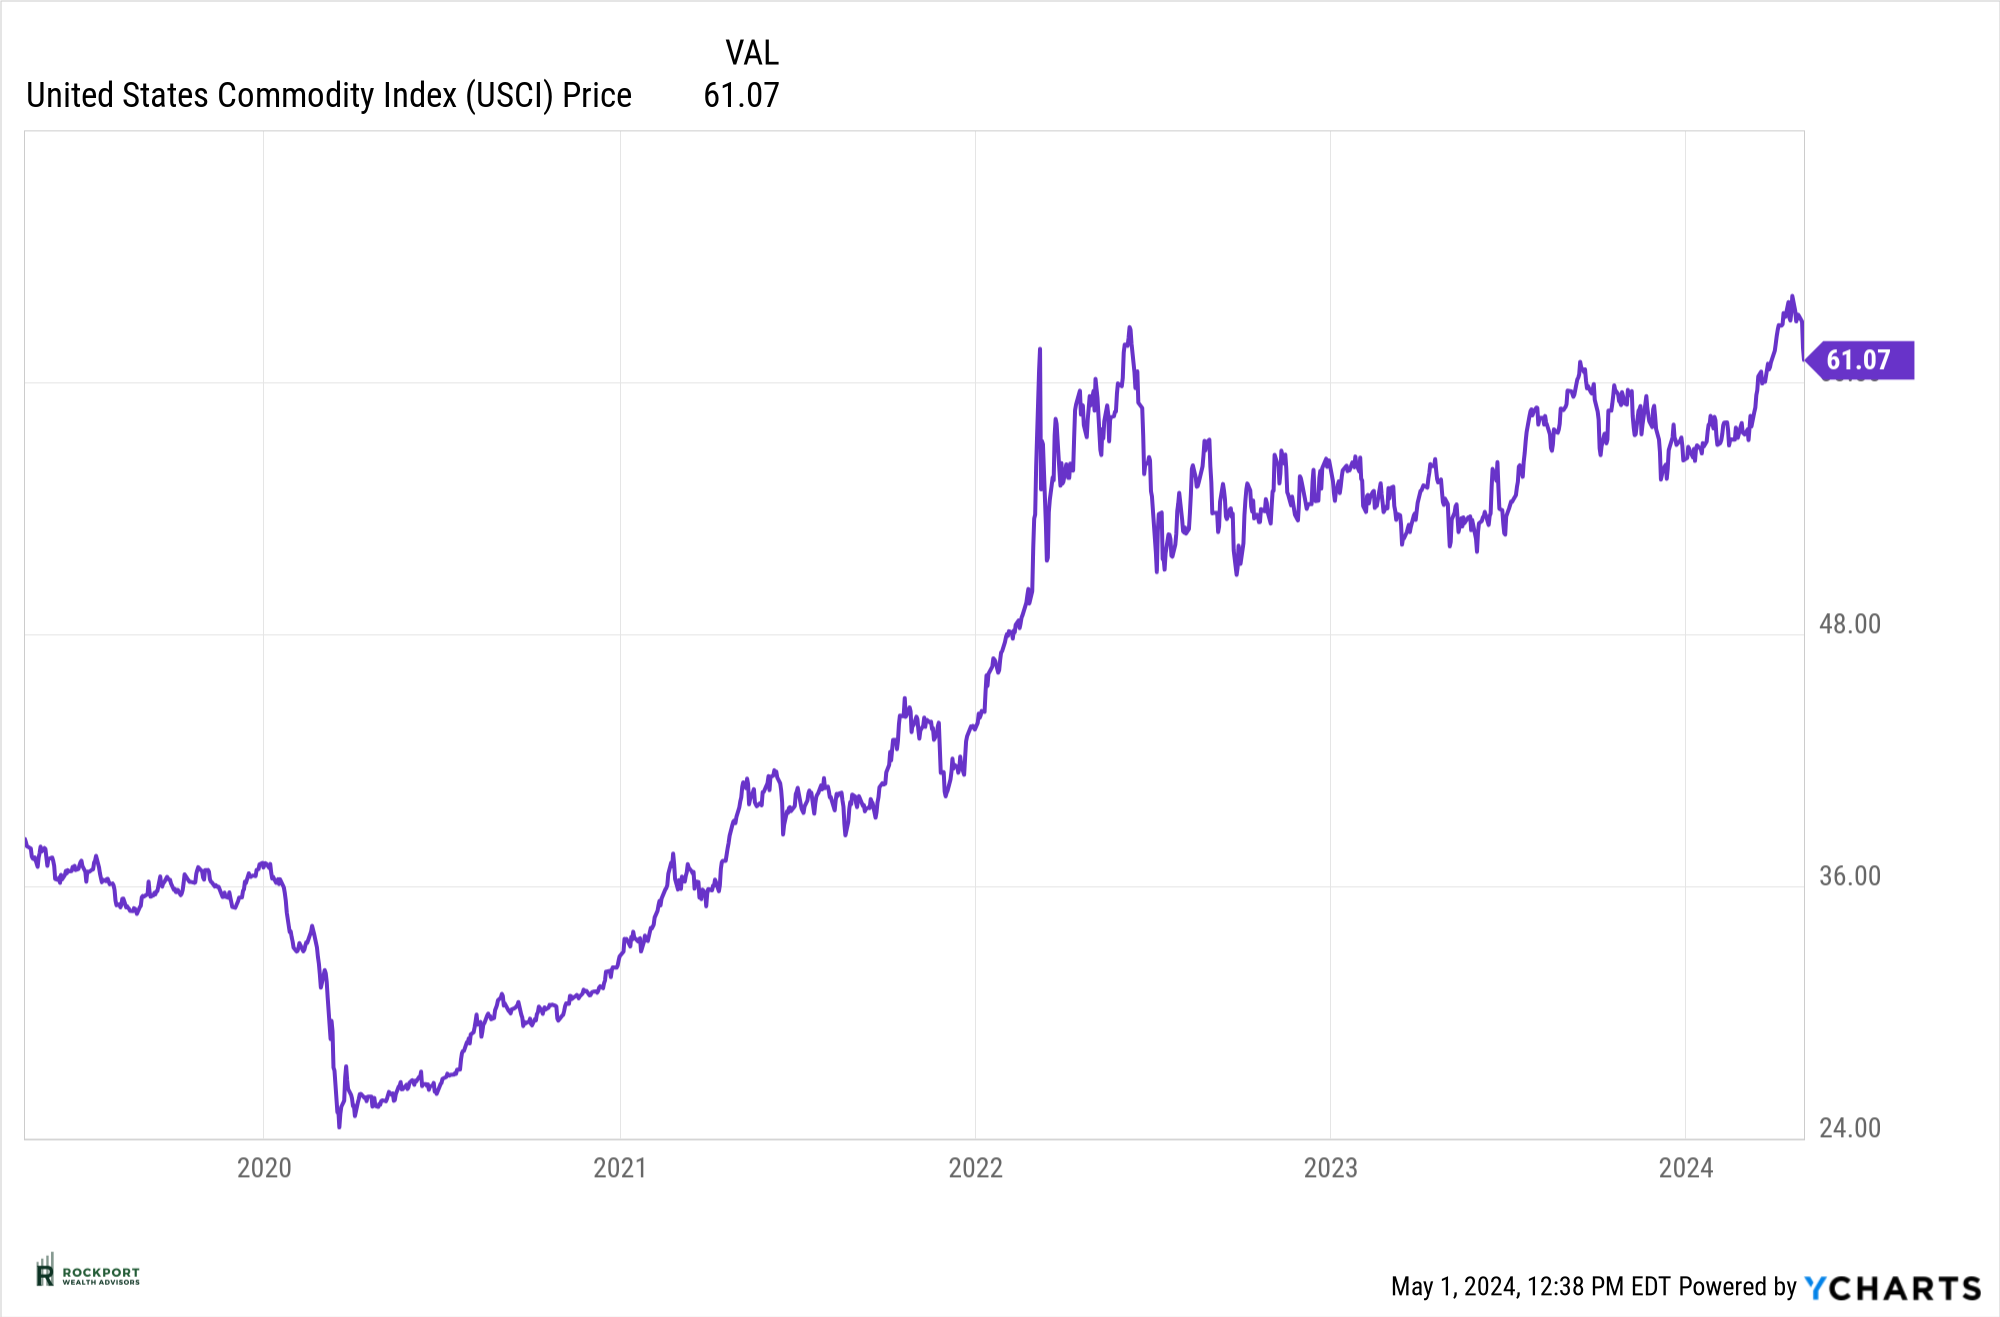
Commodities had a slight dip this past month. This is a good thing if the trend continues as it helps take pressure off of pricing and hence inflation as well. Oil declined slightly in price as well as some of the grains. The fed would welcome a continued trend like this.
All of the above back up our case for continued skepticism over the markets and economy. A lot to sort through in the coming summer months.
Tax Talk
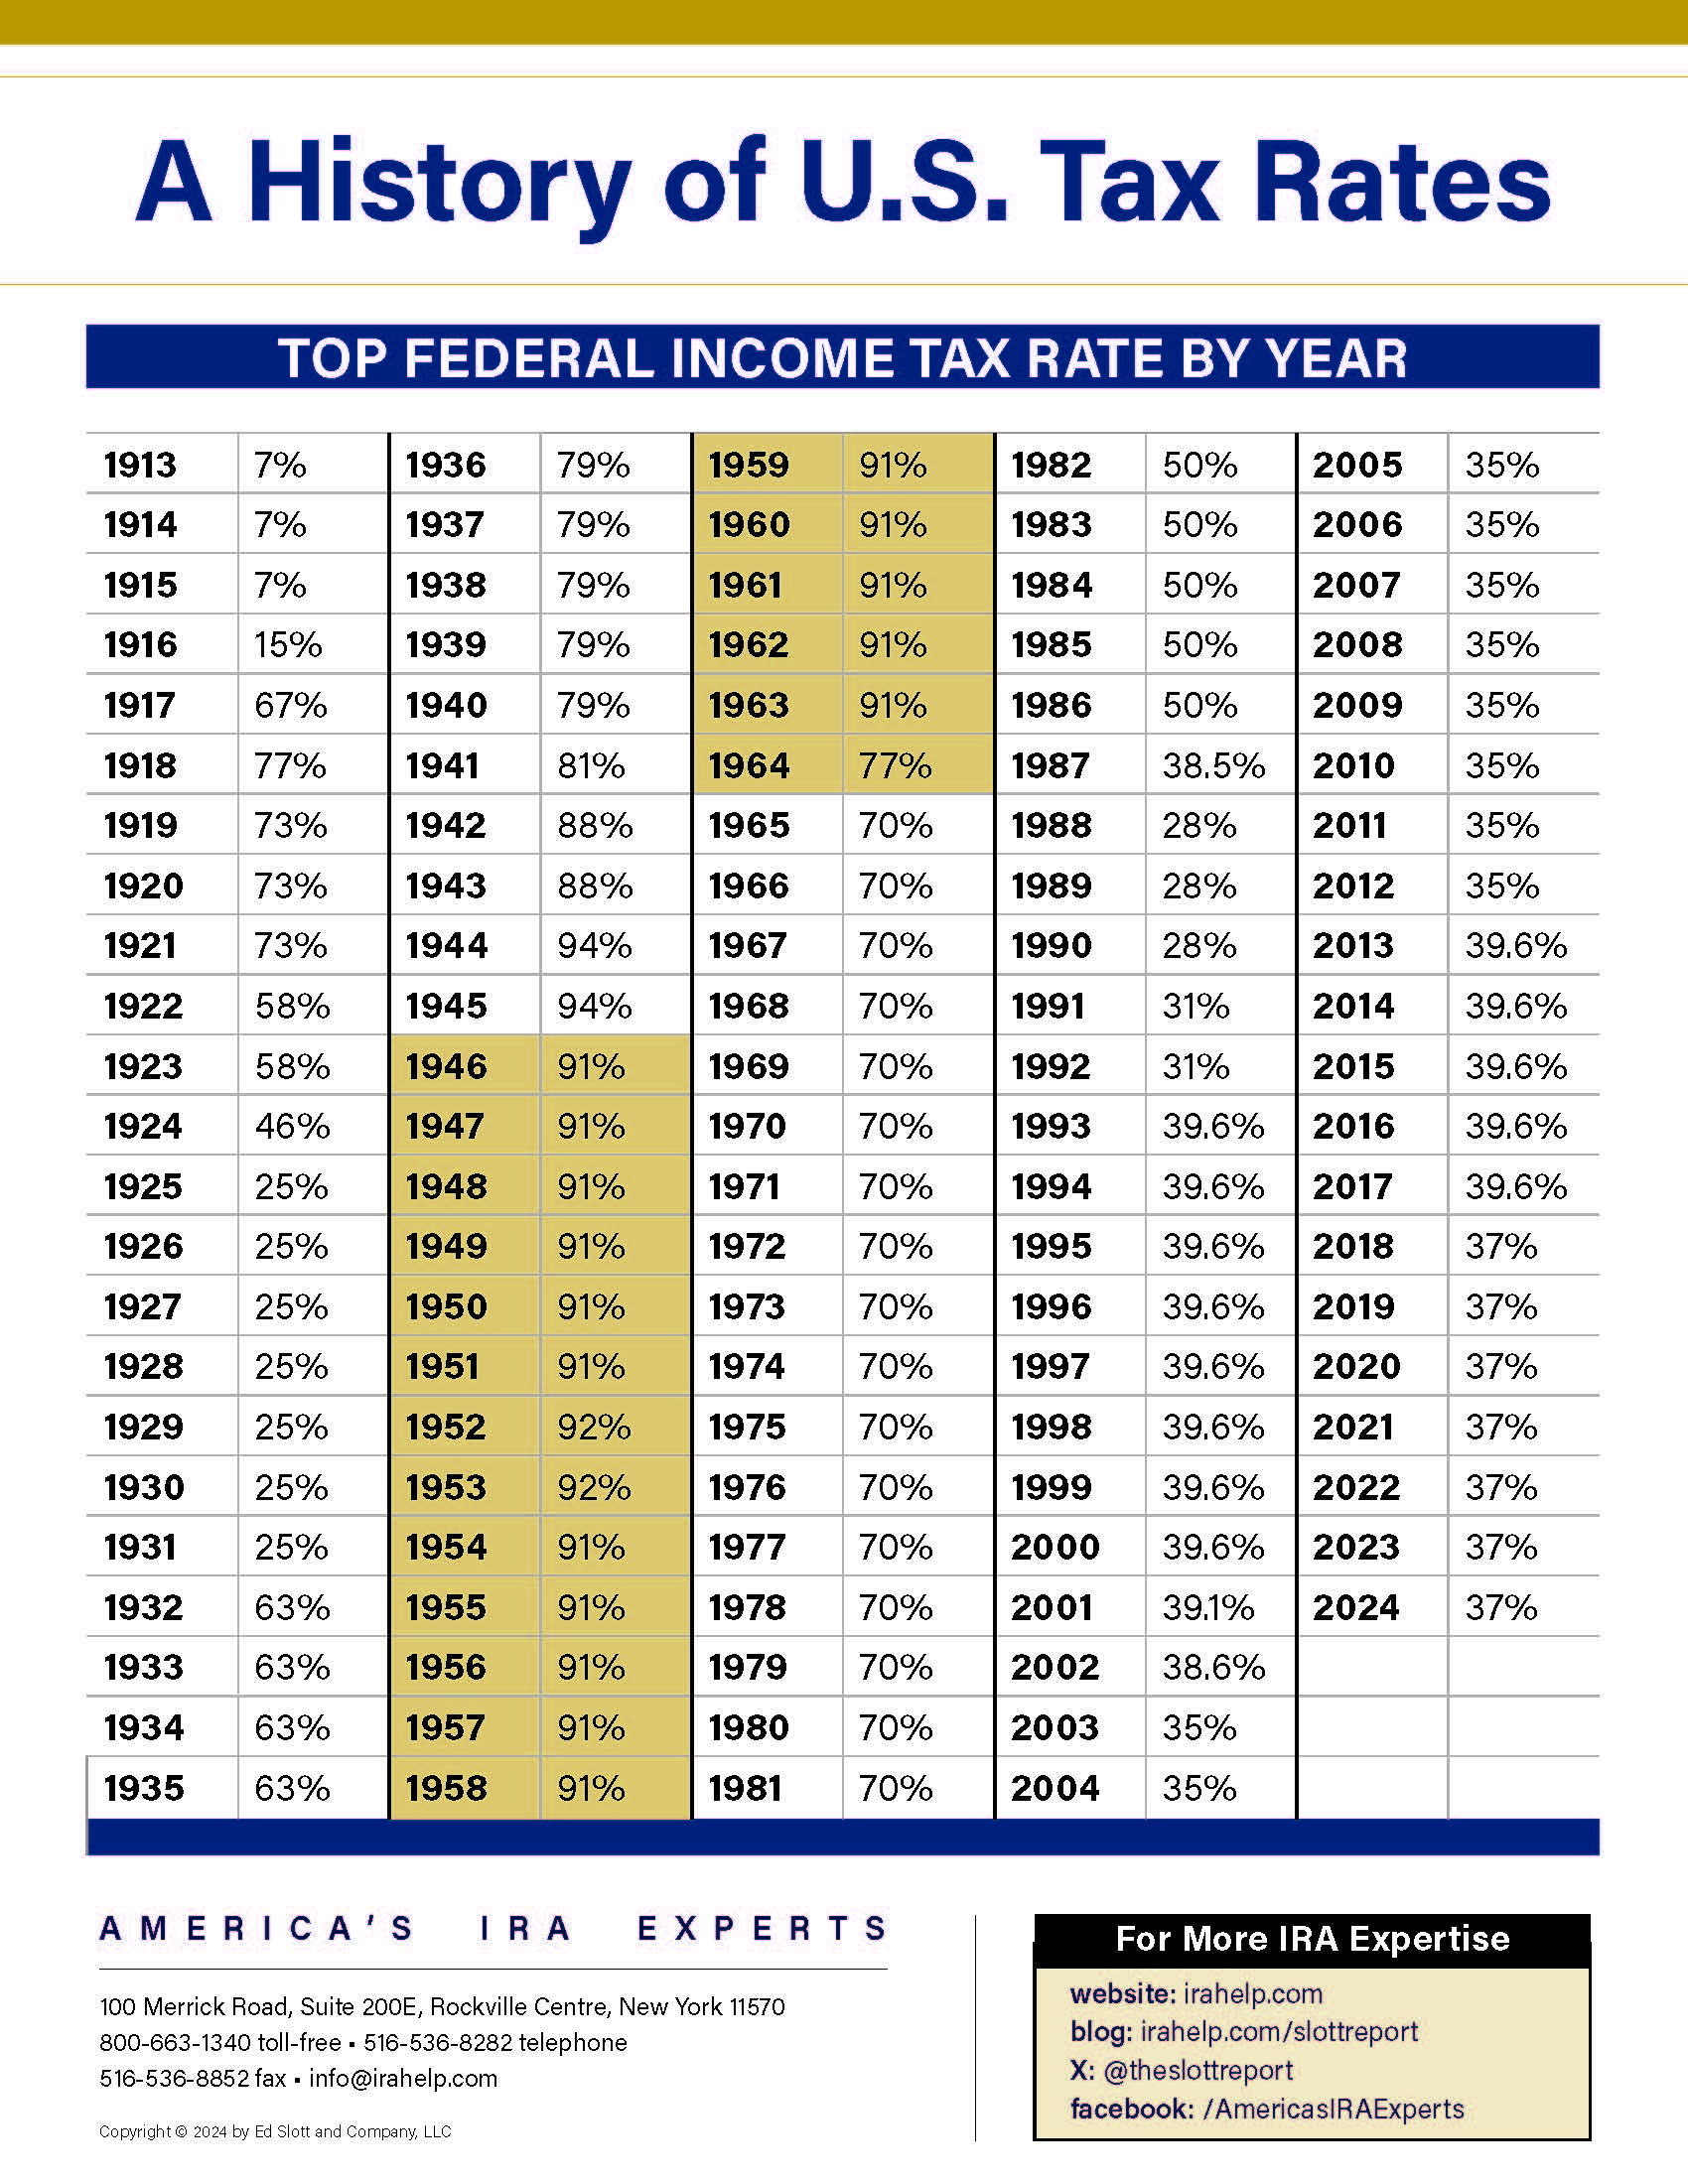
Think we pay a lot of taxes now? Currently the top bracket is 37% which historically ranks as one of the lower points in history. In the period from 1946-1964 the top bracket was an astounding 91% (not a typo!) What does this mean? Likely tax rates from here are going to move up mostly due to Government deficits which are at all-time highs. This makes tax planning of utmost importance and exploring concepts like ROTH IRA and 401K contributions as well as Roth IRA conversions essential. We have been bringing this topic up to many clients and have run analysis to see if conversions make sense for them. If this is a topic that is on your mind, please reach out. We have resources that can help with these decisions.
As always, if you have any questions on anything we have talked about here or anything else that is on your mind, please feel free to reach out.
*The Standard & Poor’s 500 (S&P 500) is an unmanaged group of securities considered to be representative of the stock market in general. Results can be found at slickcharts.com.
*Treasury yields can be found at finance.yahoo.com.
*Charts produced at yCharts.com
*Bonds can be found at bloomberg.com/markets/rates-bonds
*Fed Rate Probability Chart can be found at cmegroup.com/markets/interest-rates/cme-fedwatch-too
*The LEI can be found at conference-board.org/topics/us-leading-indicators
*Treasury Yield Curve can be found at Gurufocus.com
*University of Michigan Consumer Confidence produced at SentimenTrader
*Rockport Models – Please remember we are referencing our model portfolios, and your portfolio may differ from the models mentioned depending on your individual needs and circumstance.

