
Happy Mother’s Day to all the moms out there. Enjoy the day! 😊
Markets & Economy
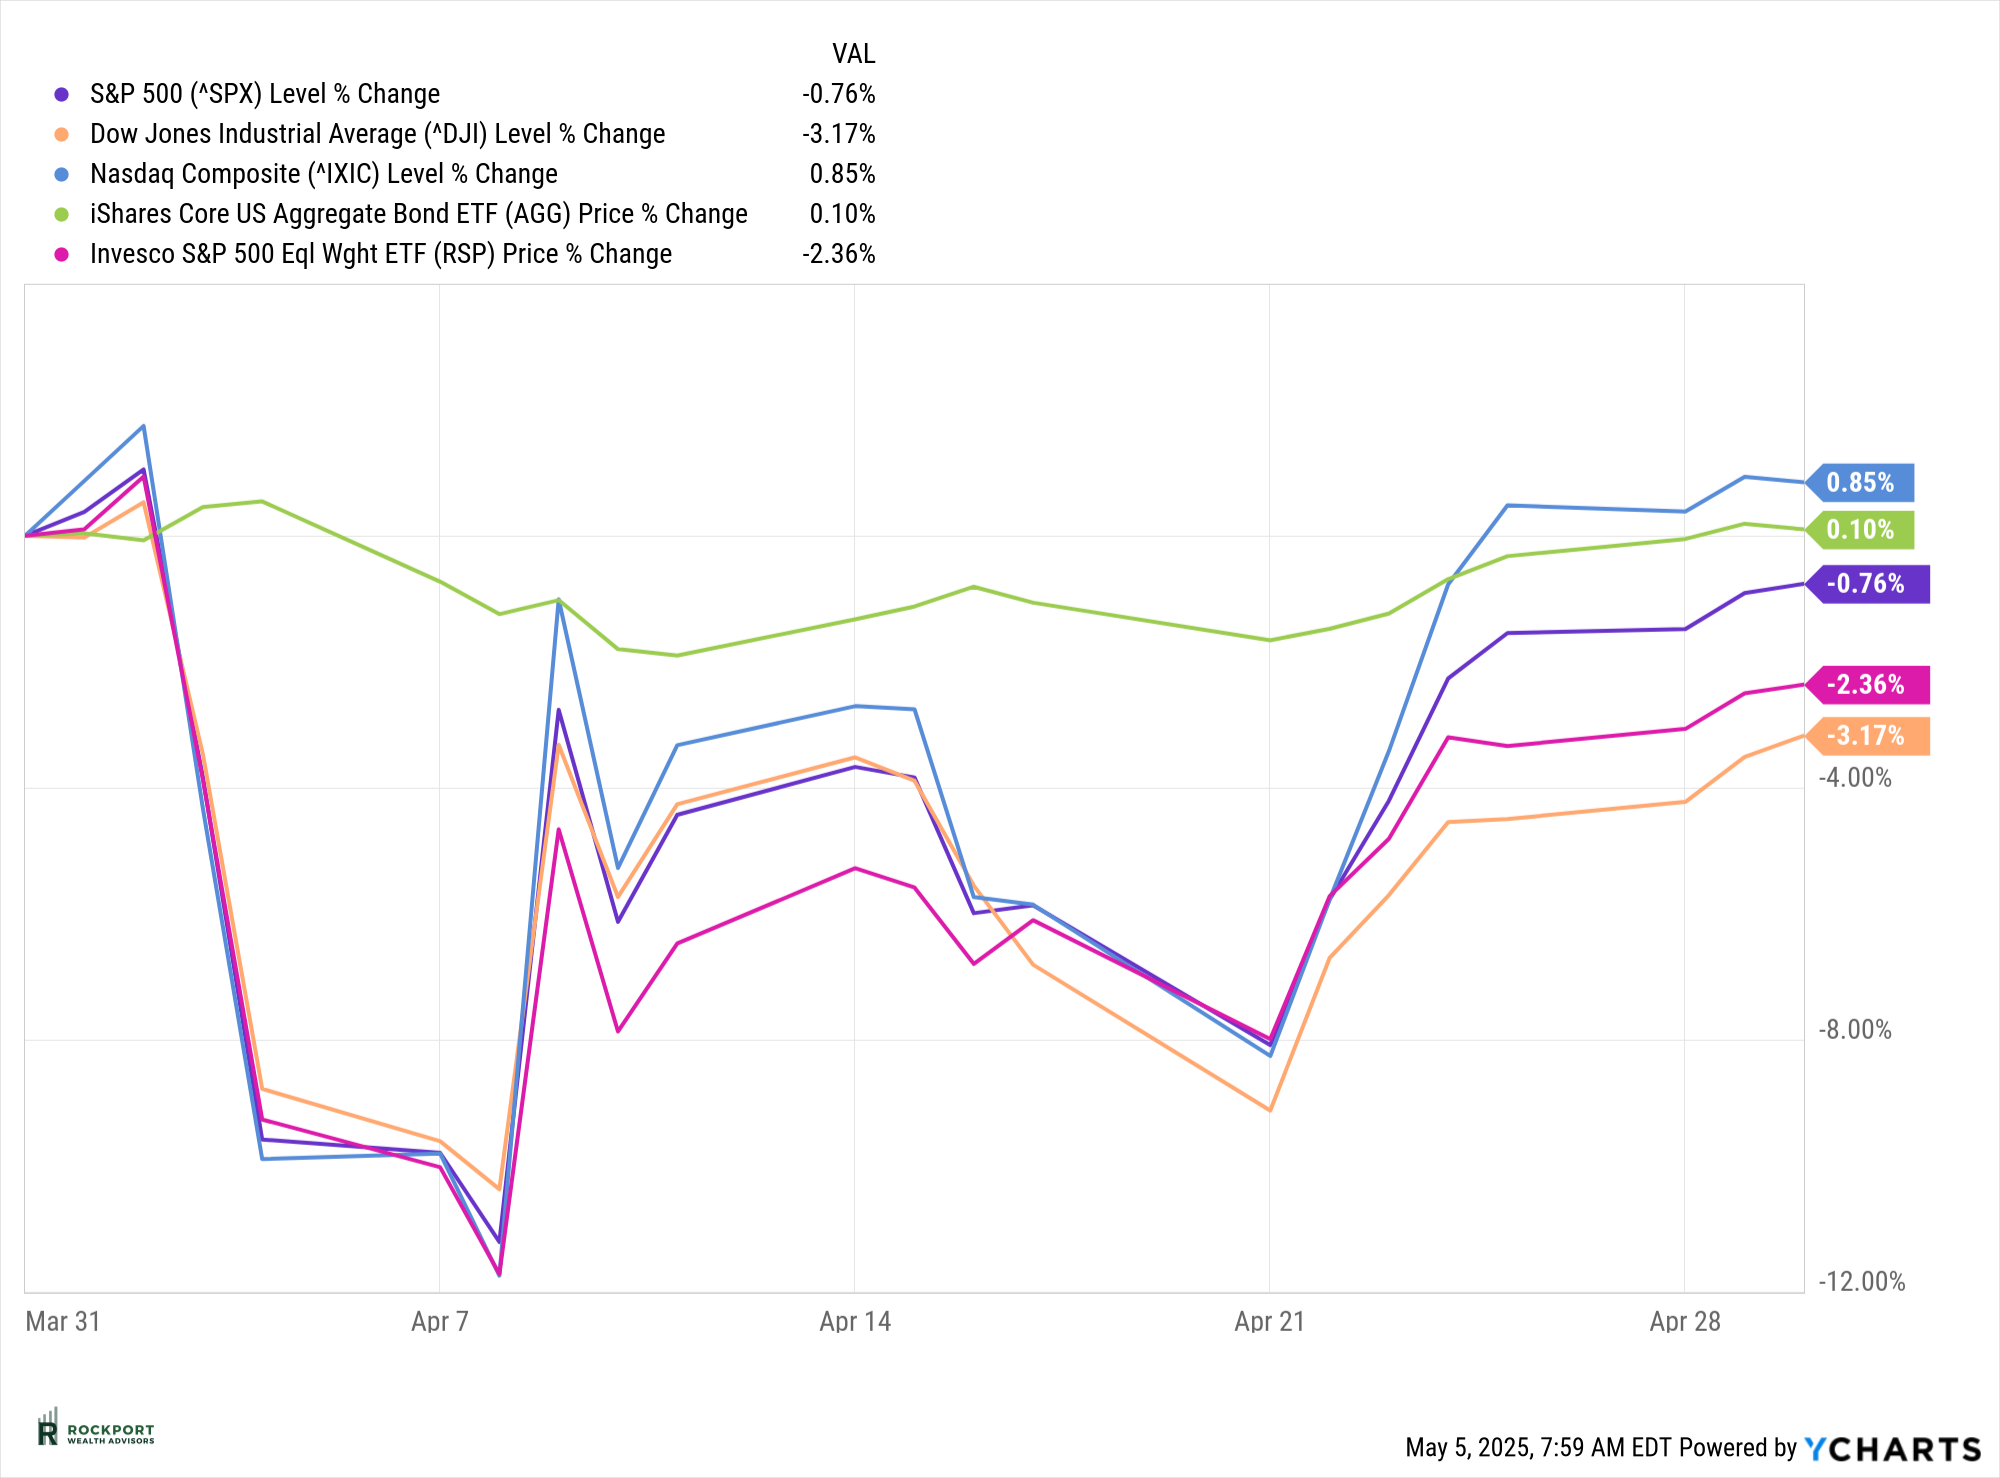
April proved to be a volatile month for the stock market, marked by sharp swings and mixed results across major U.S. indexes. While the technology sector provided a bright spot, helping buoy the Nasdaq Composite to a modest gain of 0.85%, the broader market faced headwinds. The S&P 500 edged lower by 0.76%, and the Dow Jones Industrial Average saw a more notable decline of 3.17%, driven in part by underwhelming results from several large-cap blue-chip companies.
Early in the month, markets reacted negatively to uncertainty surrounding evolving tariff policies, leading to a swift selloff. However, as the month progressed and more clarity—and perhaps a measure of optimism—emerged in the headlines, equities rebounded to recover much of their earlier losses.
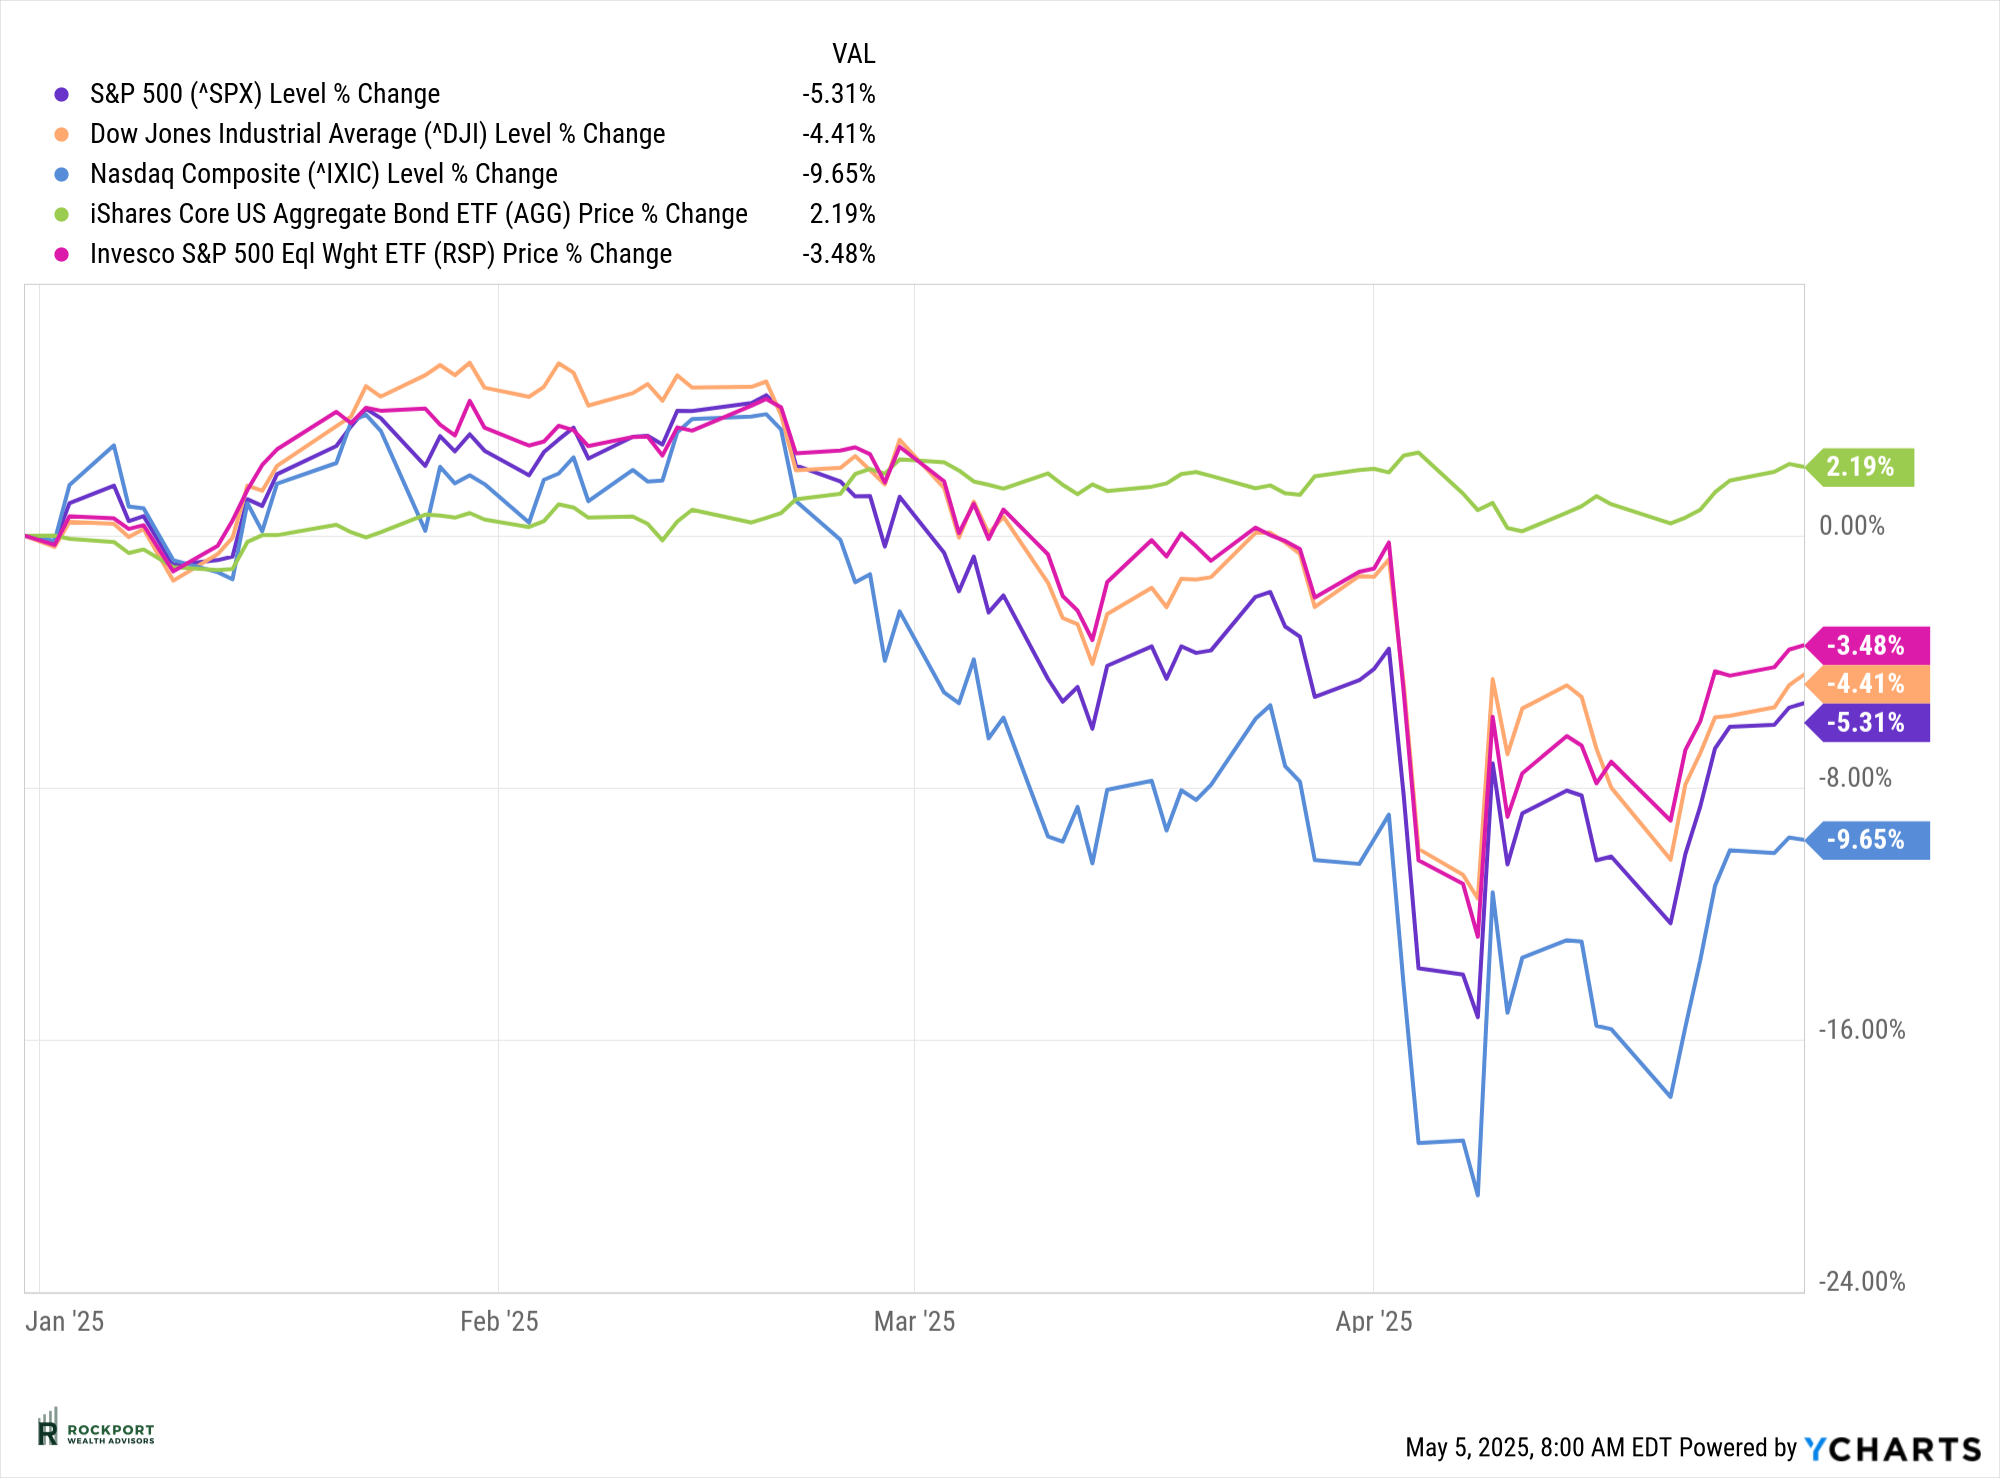
On a year-to-date basis the S&P 500 is now down 5.31%. The NASDAQ has been the hardest hit of the major US indexes with a decline of 9.65%. Bonds have shown signs of strength and are up 2.19% year-to-date. All in all, it’s a mixed picture underscoring the importance of diversification and a long-term perspective in today’s dynamic market environment.
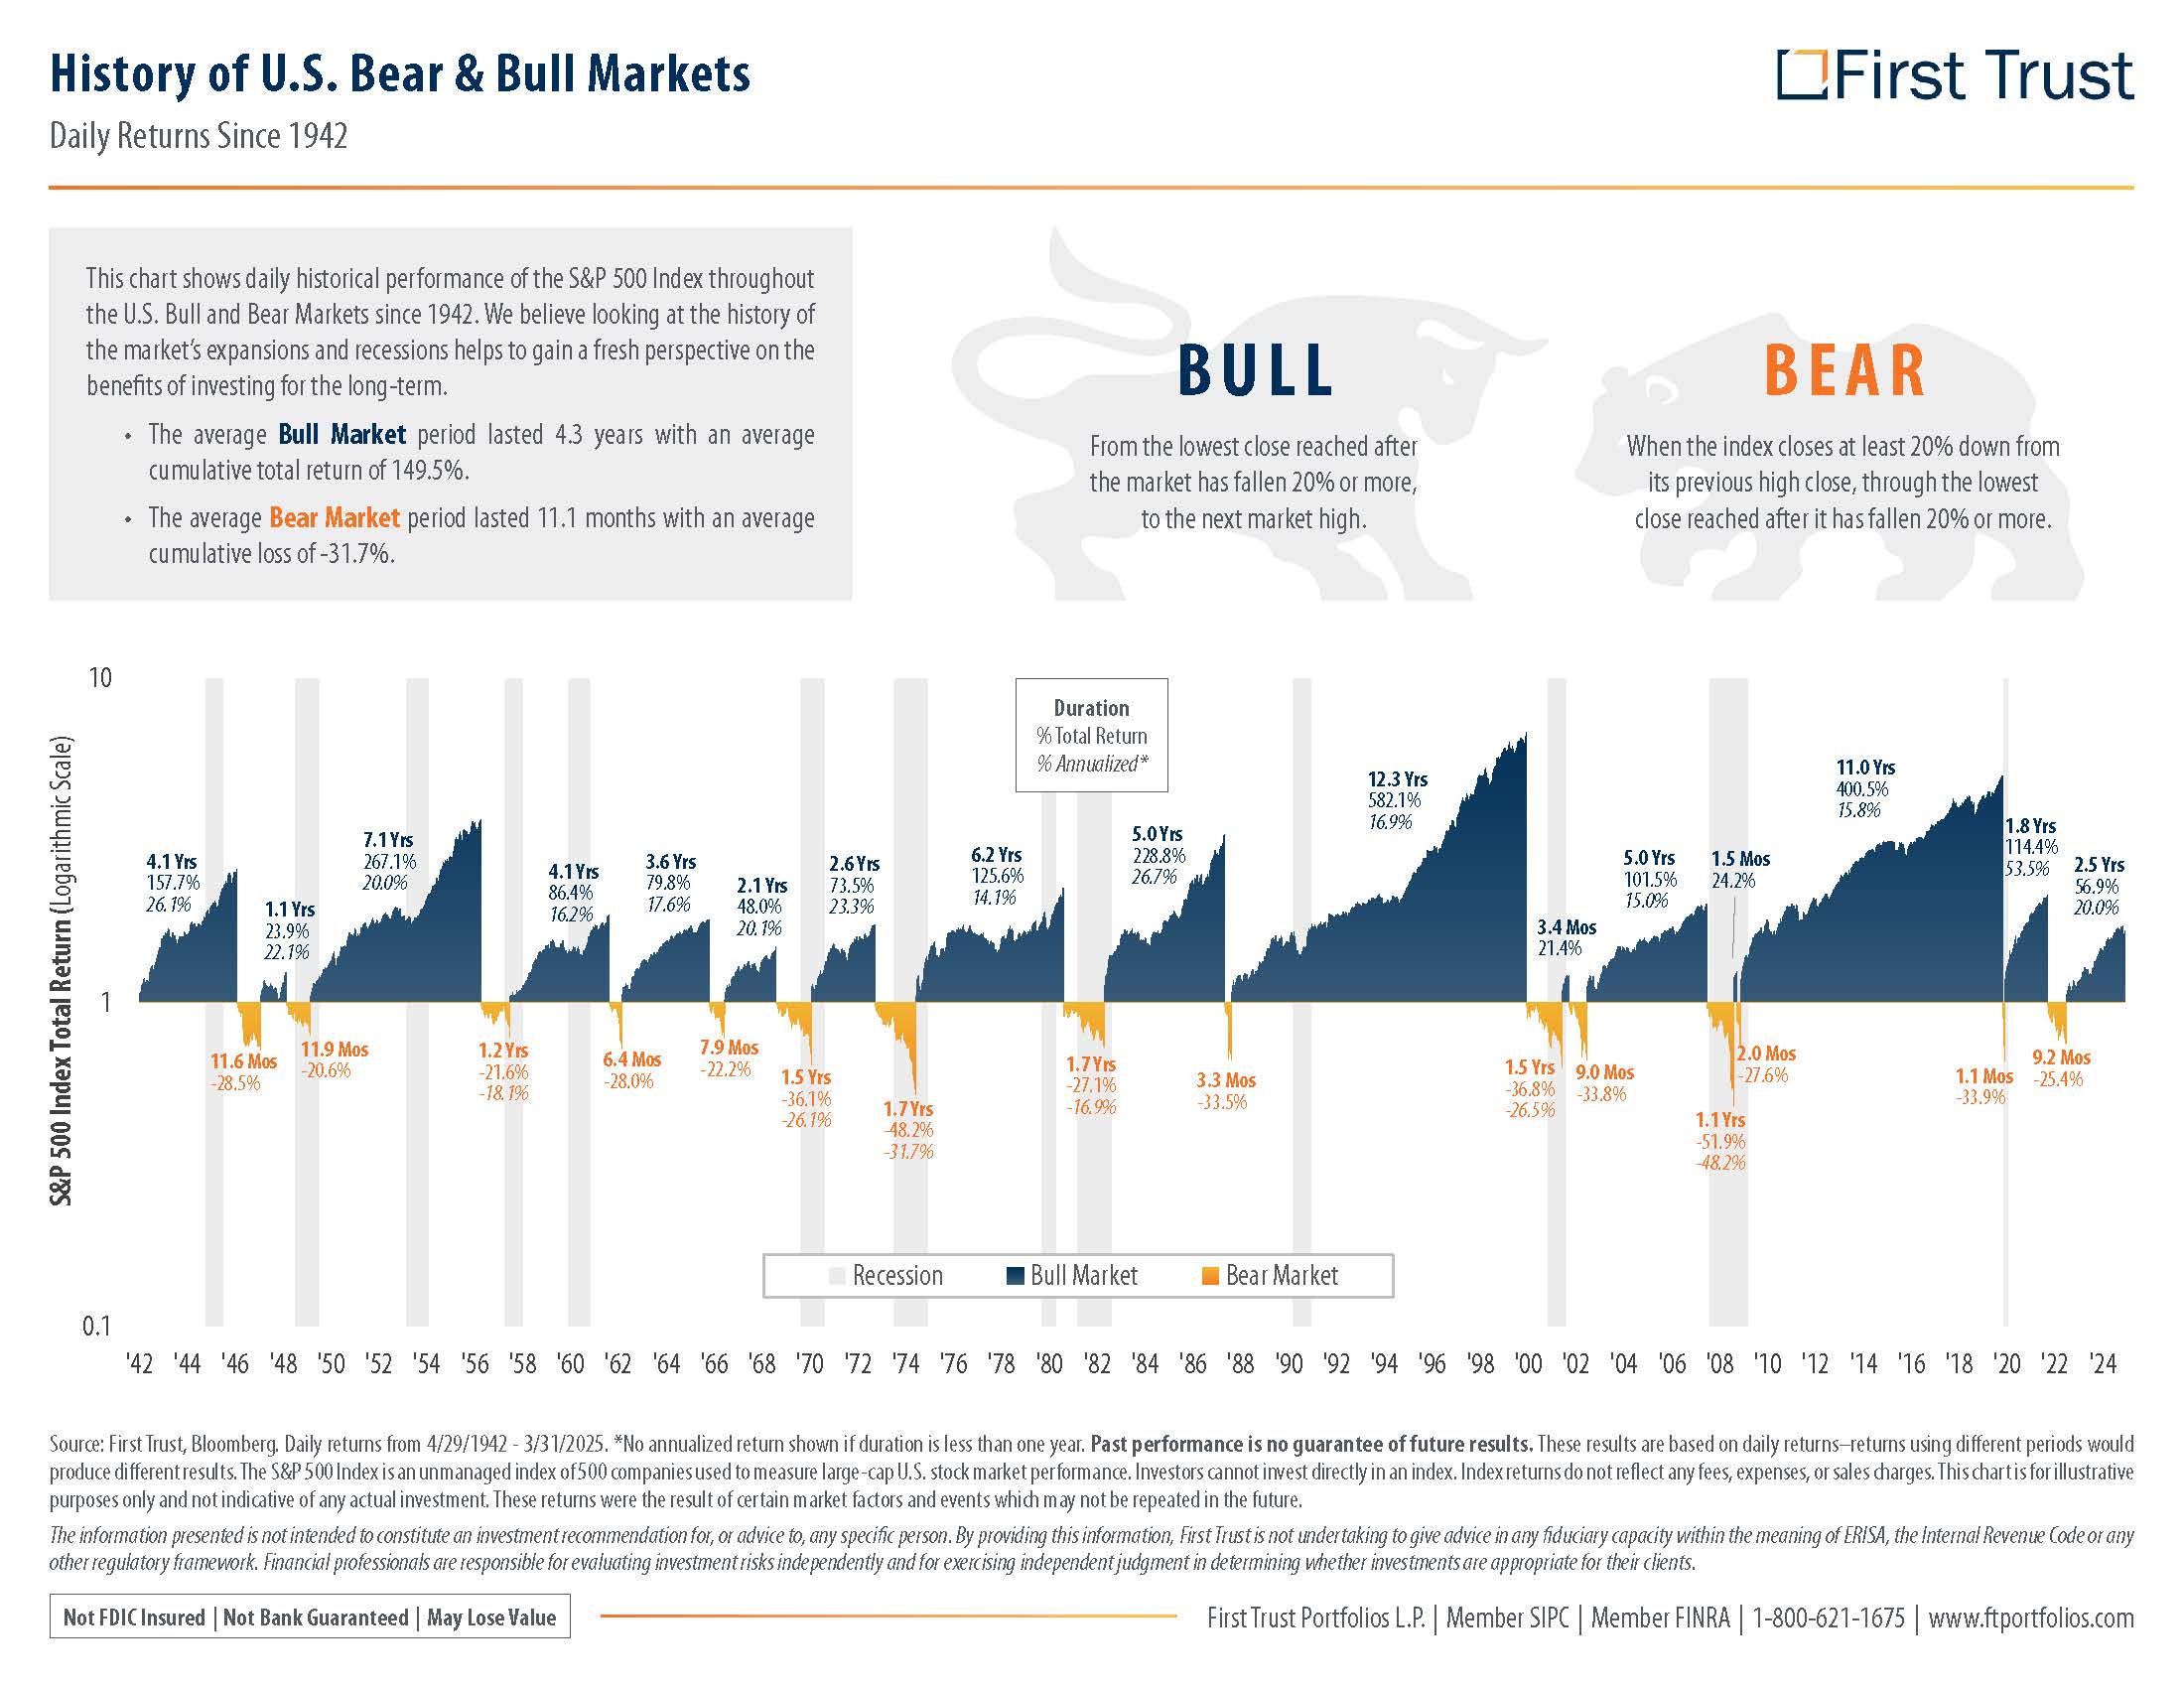
One of the most common questions we’re hearing right now is, “Are we out of the woods yet?” The honest answer is: no one can say for certain. However, history offers some perspective—and suggests it’s unlikely.
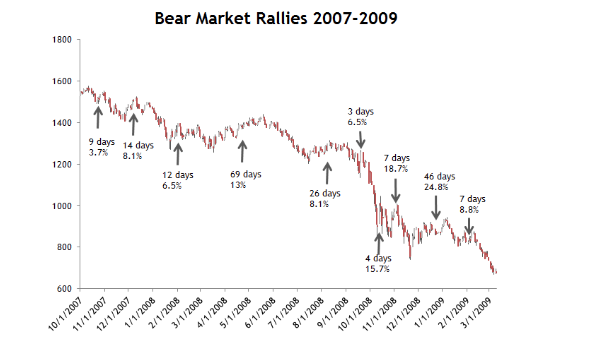
As the chart below from First Trust illustrates, the average bear market has lasted about 11.1 months. If the recent downturn has indeed ended, it would rank as the second-shortest bear market on record, trailing only the brief pullback in the spring of 2020. While such an outcome isn’t impossible, it’s not the most probable either. Bear markets often take time to run their course, and history shows that meaningful rallies can occur within them. For example, during the 2008 bear market—one of the most severe in recent memory—there were 10 separate rallies, one of which lasted 69 days.
To be clear, we’re not suggesting this is a repeat of 2008, nor are we in the business of calling market tops or bottoms—such predictions are notoriously unreliable. What we are saying is that it’s premature to declare an “all clear” just because the headlines might sound optimistic. Our approach remains rooted in disciplined analysis, focusing on data and long-term strategy rather than short-term noise.
As we look ahead to the remainder of 2025, we’re closely monitoring five key data points that we believe are especially relevant to understanding the current economic landscape and shaping investment decisions: Gross Domestic Product (GDP), Consumer Confidence, Oil prices, the 2-Year Treasury yield, and Inflation.
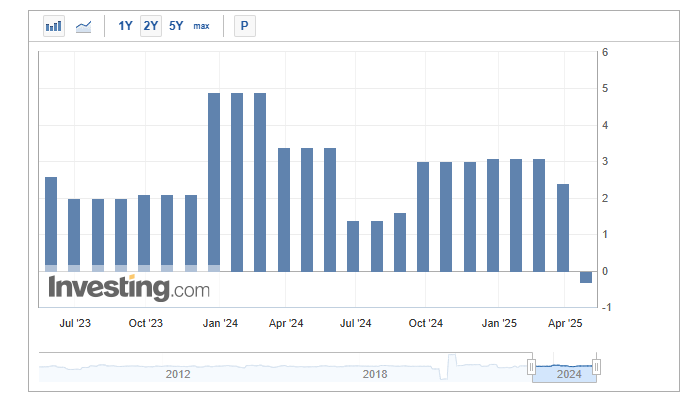
Starting with GDP, the first quarter came in slightly negative at -0.2%. As the chart below illustrates, this isn’t a common occurrence—and it’s worth noting because two consecutive quarters of negative GDP growth typically define a recession. Fortunately, early indicators for the second quarter do not currently suggest continued contraction, which means a technical recession could be avoided for now. That said, the economy is clearly showing signs of slowing. Just how much remains to be seen.
We’ll get more clarity when the second-quarter GDP report is released in July—a date that may feel like a long way off in such a rapidly changing environment. We’ll revisit this data point then and assess what it means for our broader outlook.
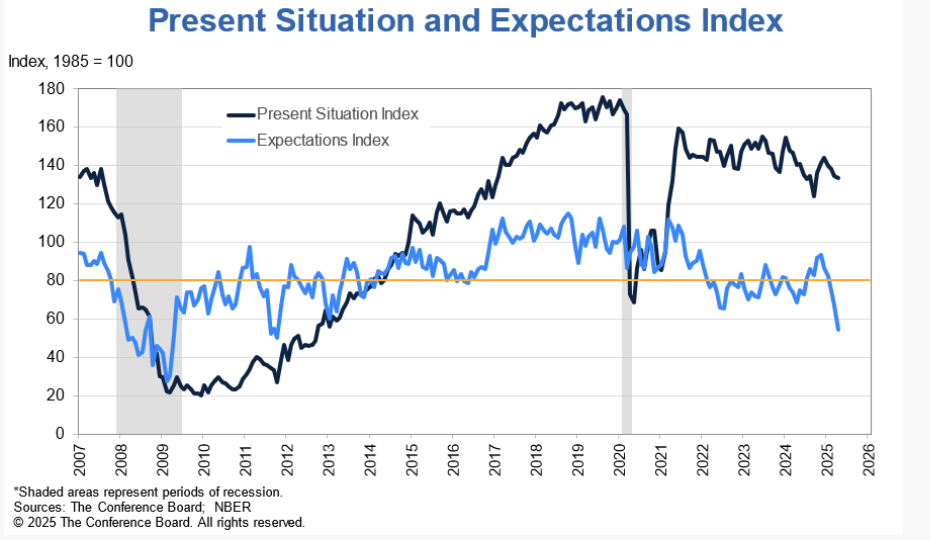
Unsurprisingly, given the current environment, Consumer Confidence has taken a noticeable hit. This is a critical development, as consumer spending accounts for a significant portion of U.S. economic activity. When confidence weakens, reduced spending often follows—potentially accelerating a slowdown or even tipping the economy toward recession.
Both current sentiment and future expectations have declined, as shown in the chart below. While it’s difficult to pinpoint a single cause, it’s likely a combination of recent market volatility and persistent uncertainty surrounding trade and tariff negotiations. Whatever the reason, it’s clear that consumers are feeling increasingly cautious about both the near and intermediate term.
Looking ahead, it will be worth watching whether confidence rebounds as quickly as it fell, particularly if progress is made on trade discussions and more favorable headlines begin to emerge. Consumer sentiment tends to be reactive—so improved clarity or resolution on key issues could help stabilize this vital indicator.
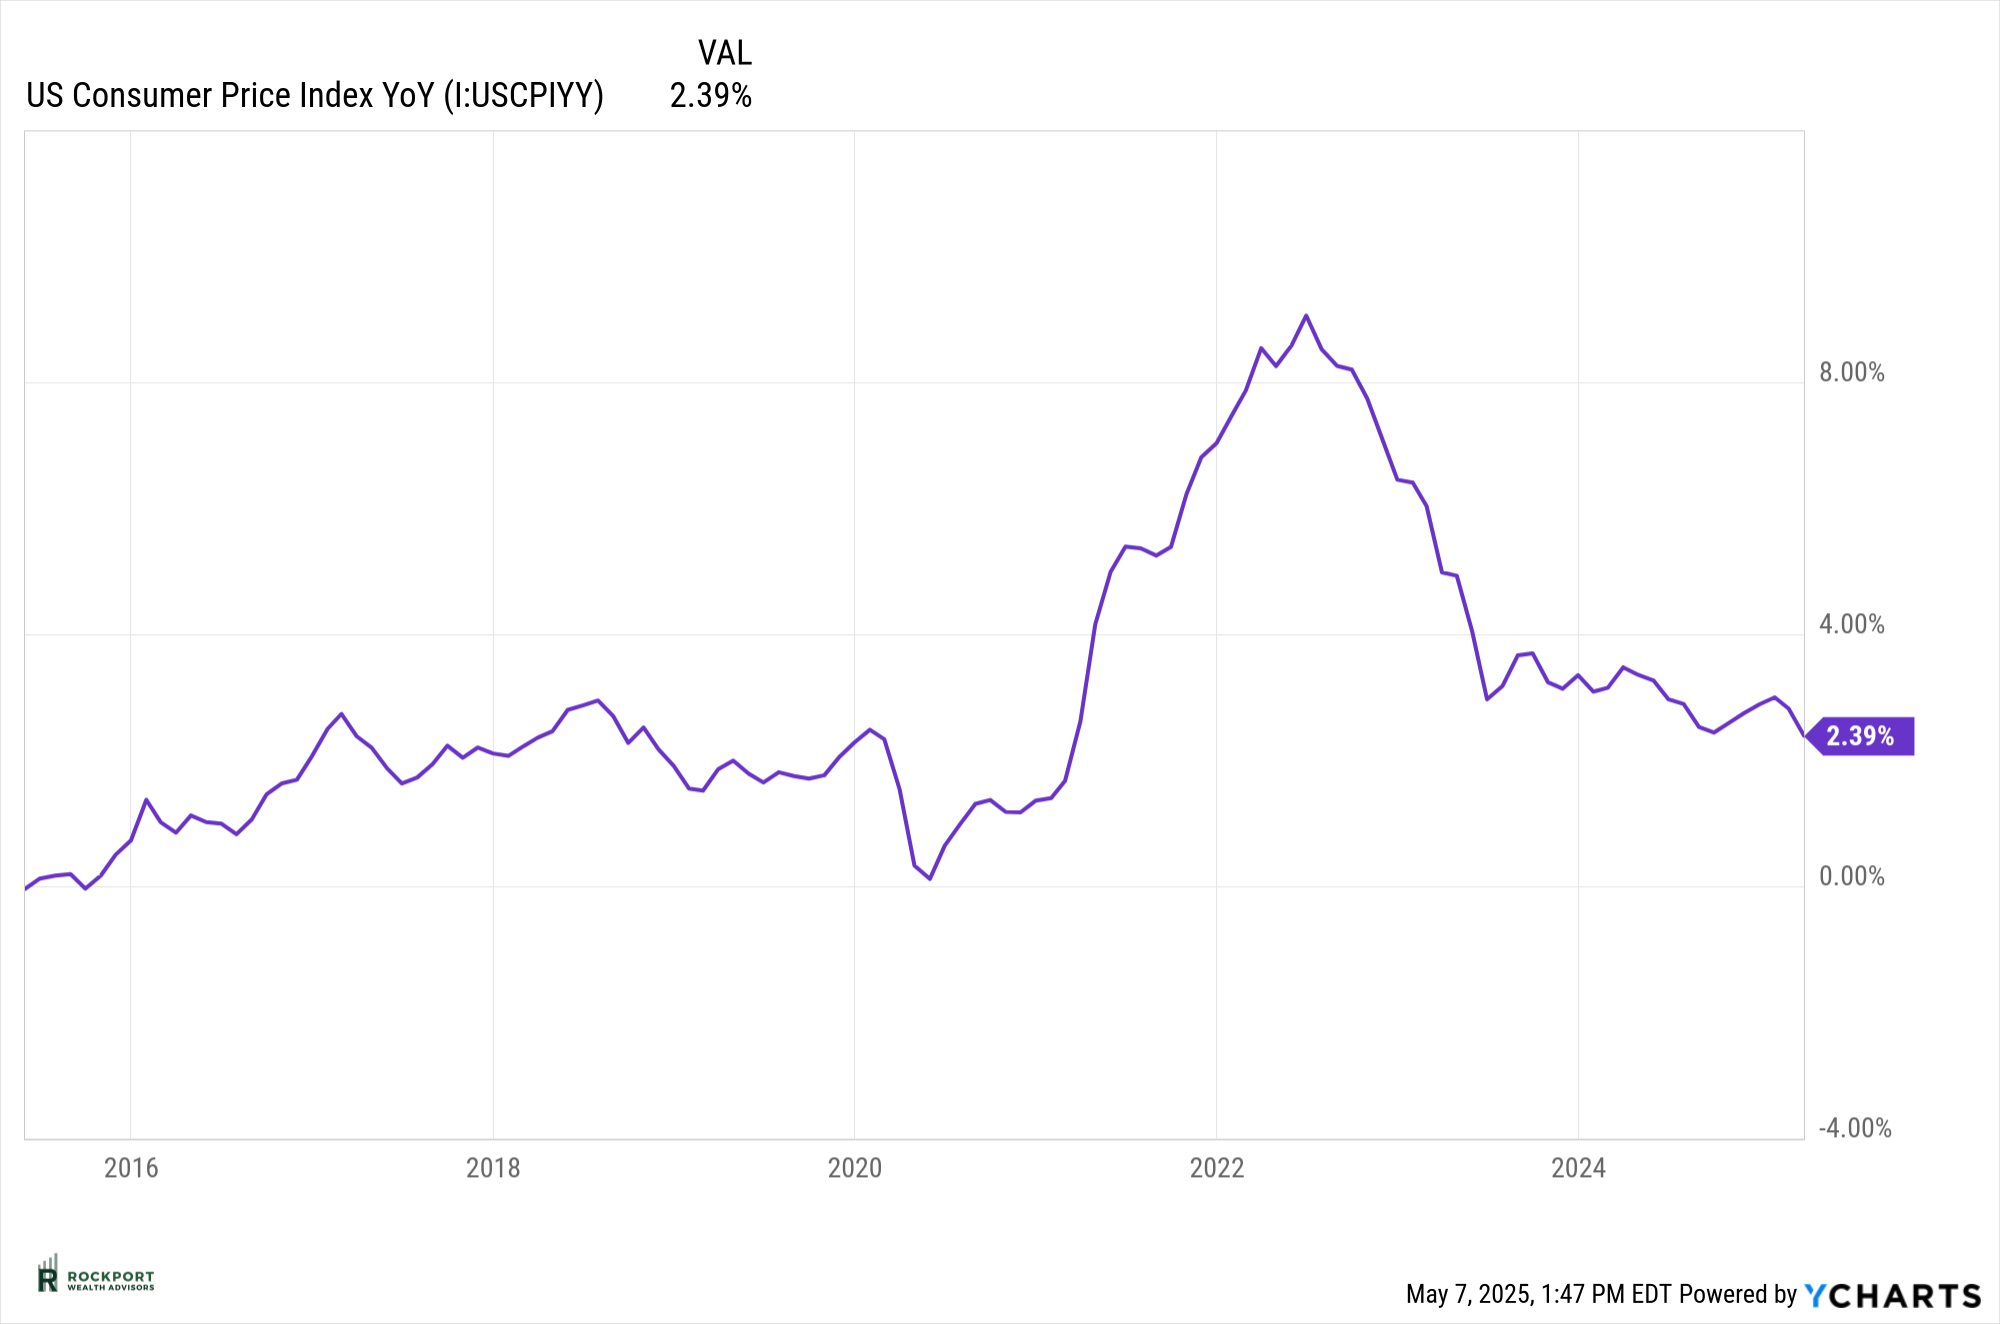
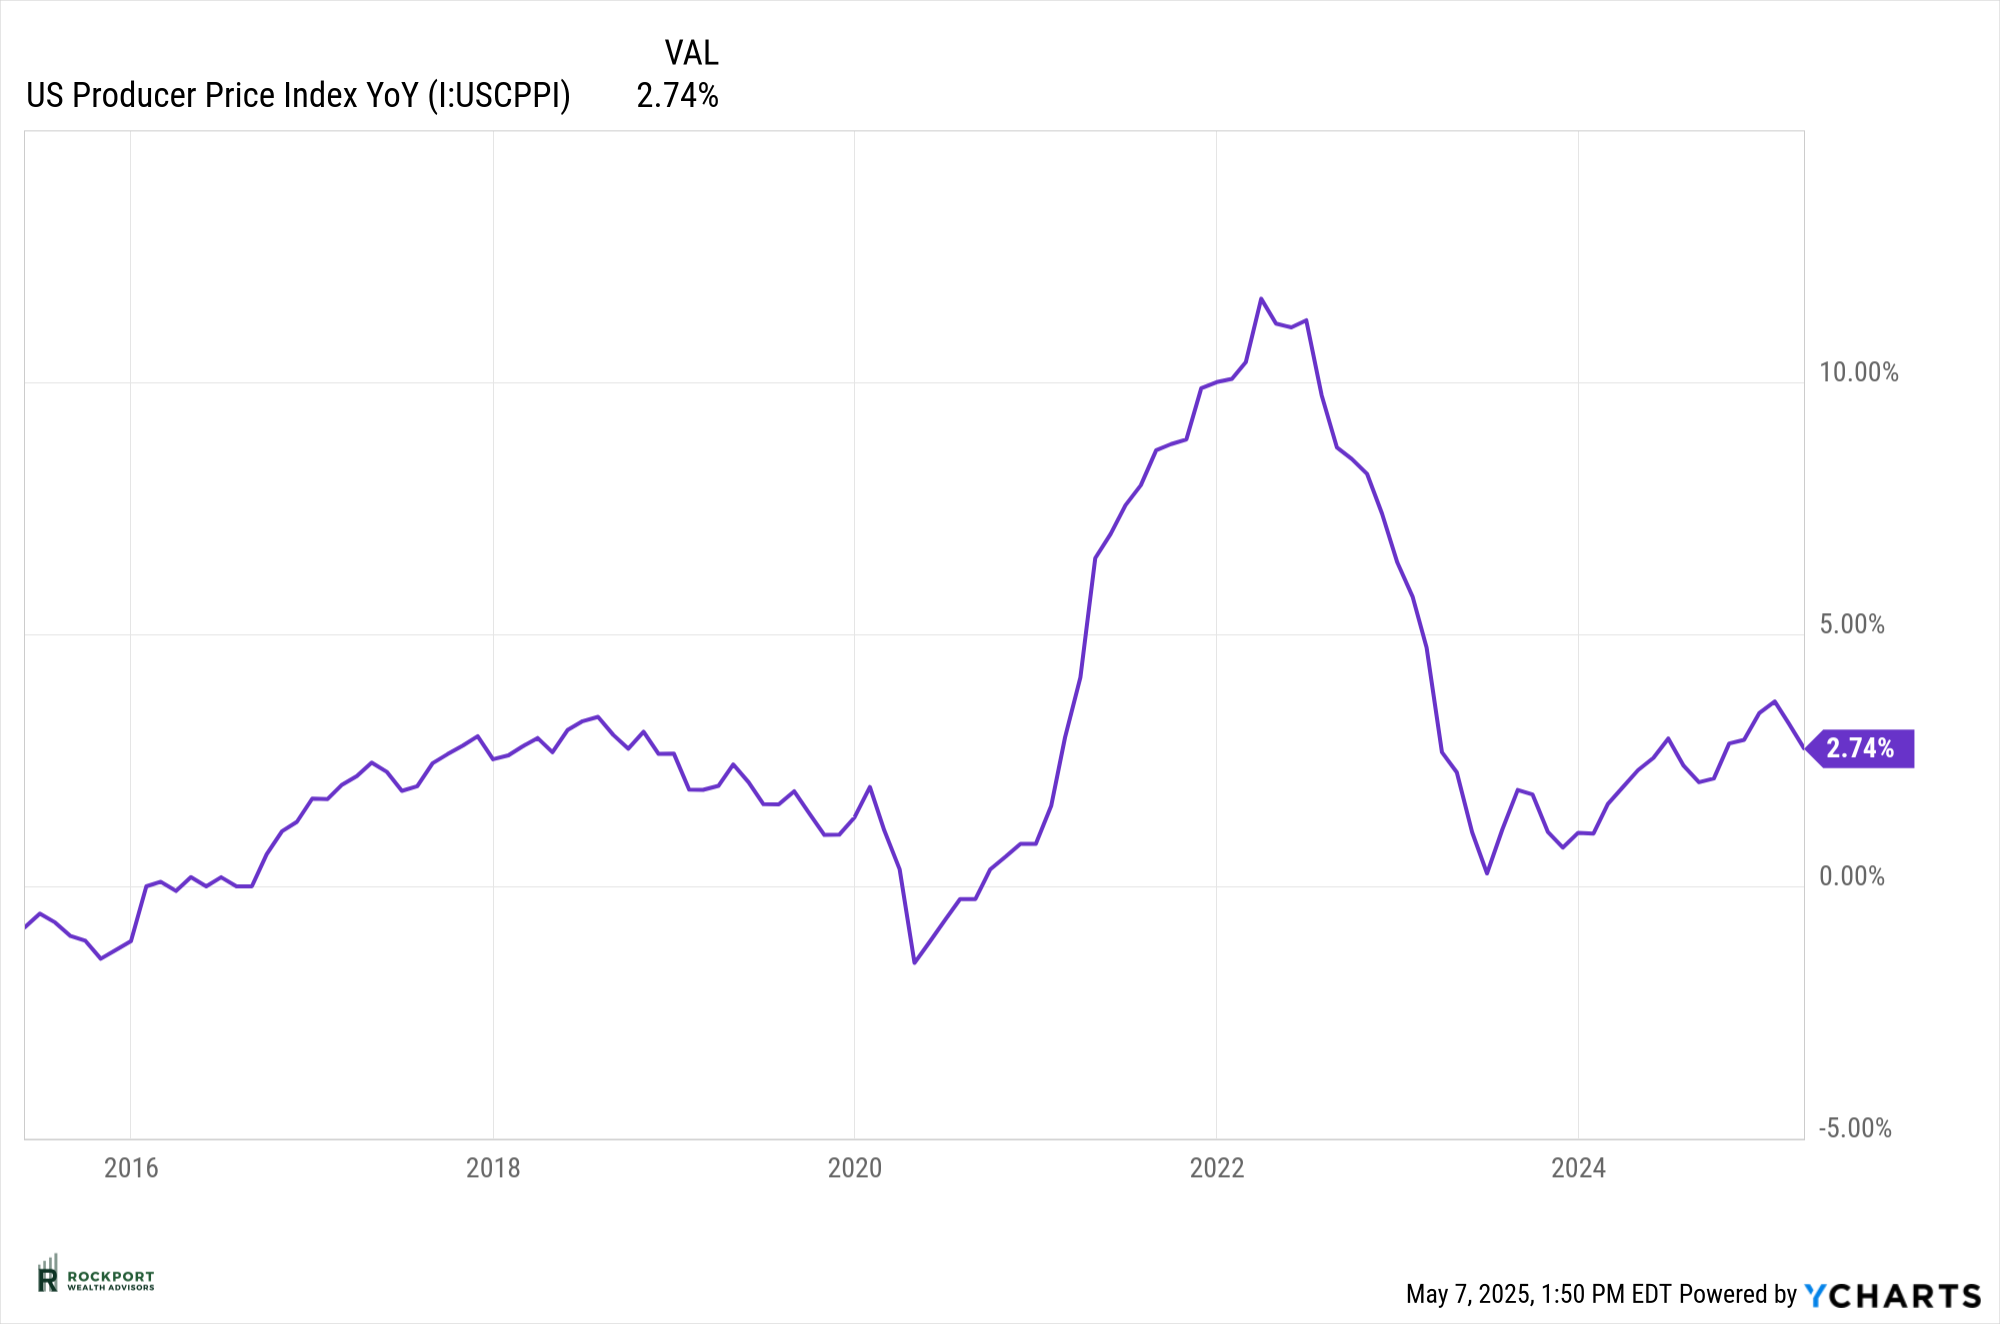
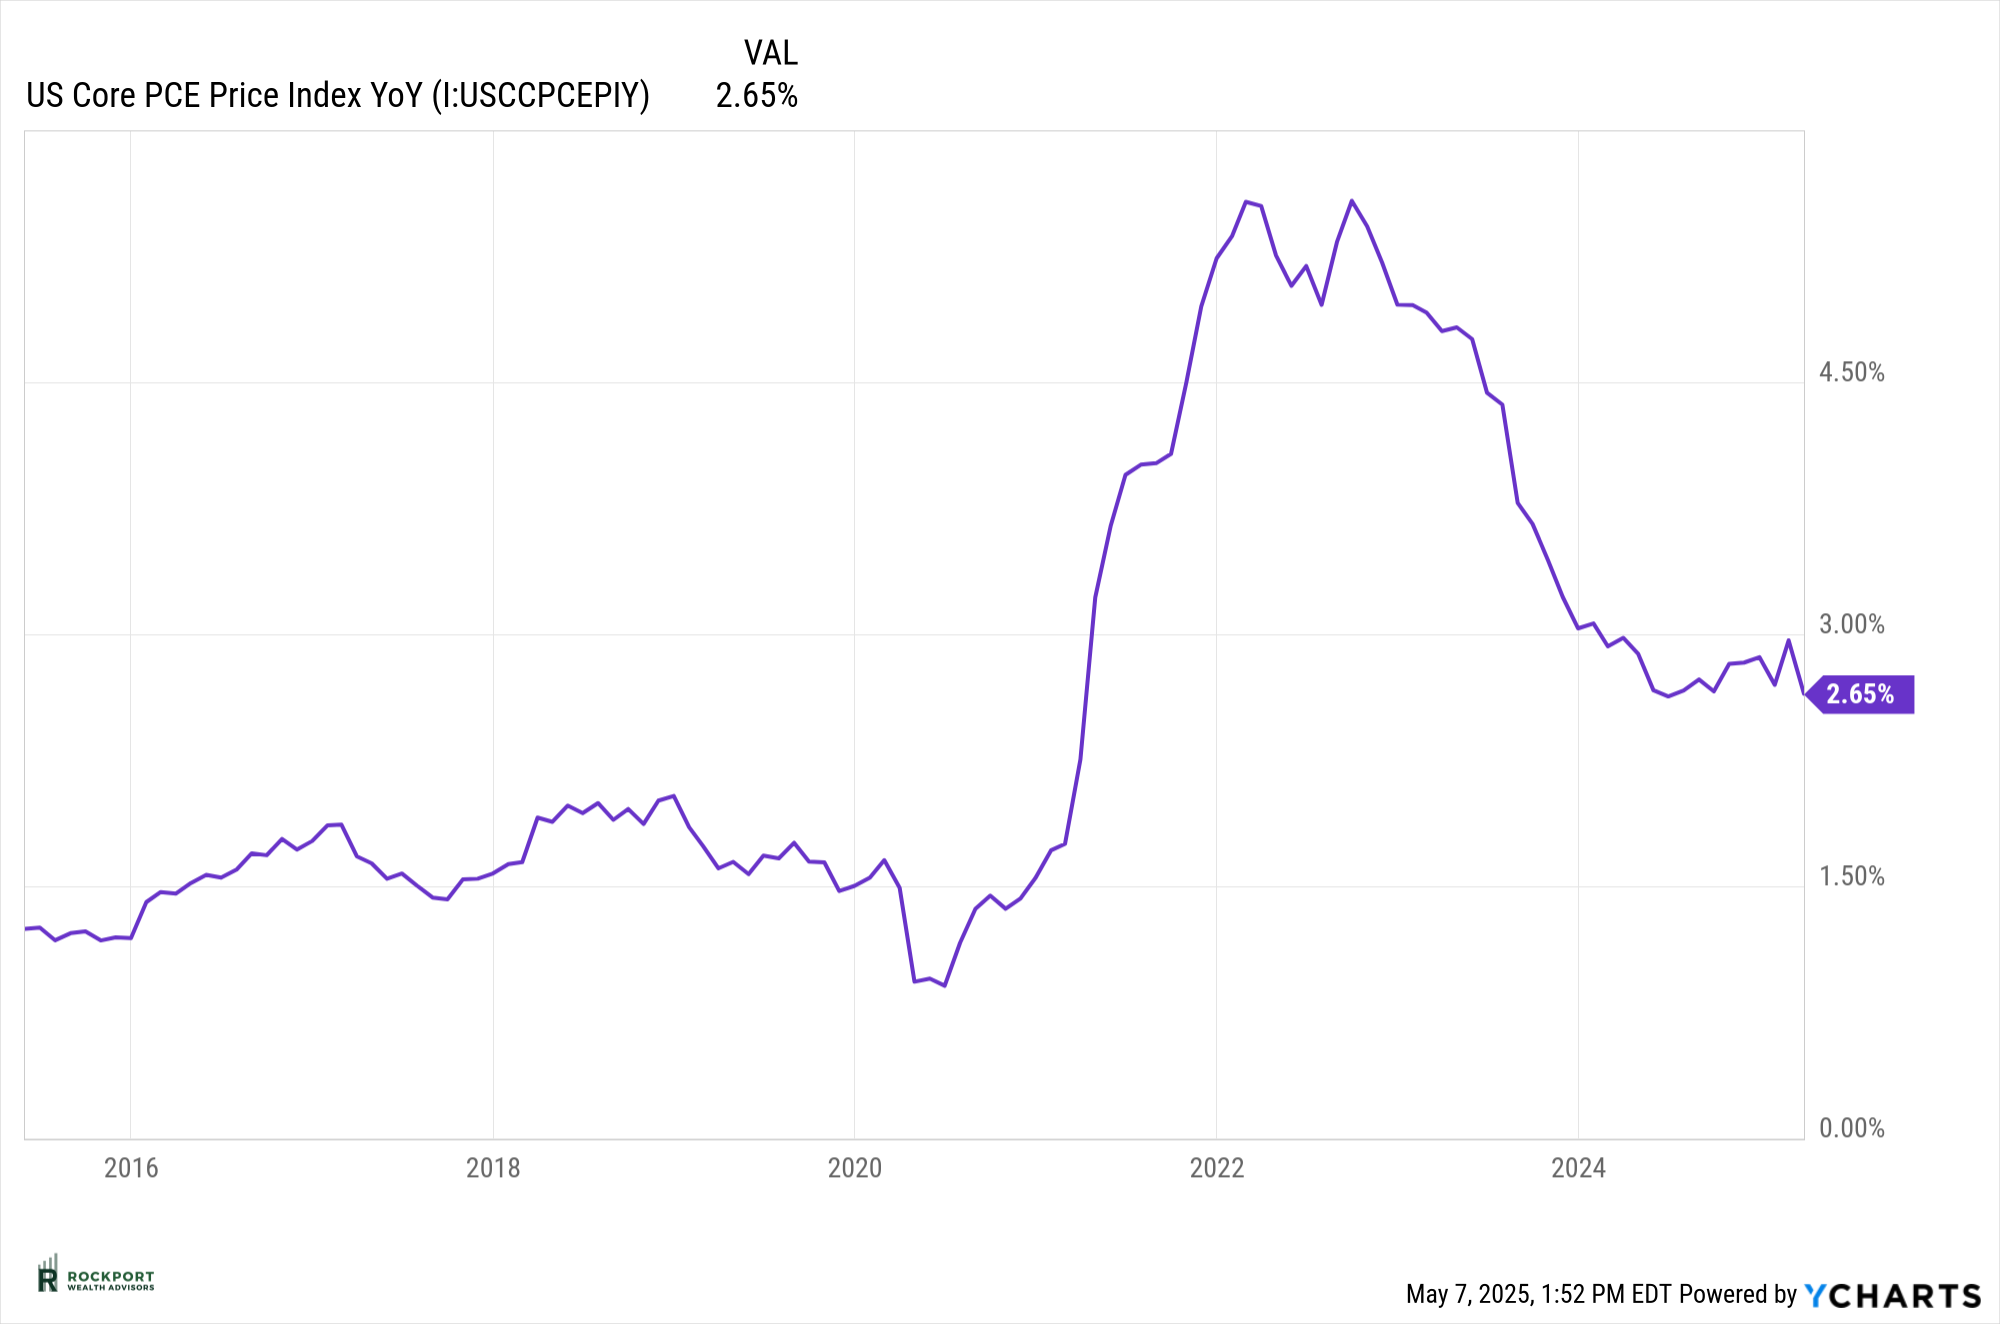
Inflation has shown signs of easing over the past few months—a trend that aligns with the Federal Reserve’s broader goals. As illustrated in the charts below, three key measures of inflation—Personal Consumption Expenditures (PCE), the Consumer Price Index (CPI), and the Producer Price Index (PPI)—all indicate a modest but clear cooling in price pressures recently.
This is certainly a welcome development. Lower inflation not only supports consumer purchasing power but also provides the Federal Reserve with greater flexibility in considering potential interest rate cuts. That said, there are early signals suggesting inflation could tick back up in the coming months, particularly if energy prices rise or wage pressures persist.
In the short term, this moderation gives the Fed some breathing room. But as always, inflation remains a dynamic and closely watched variable in shaping both monetary policy and market expectations.
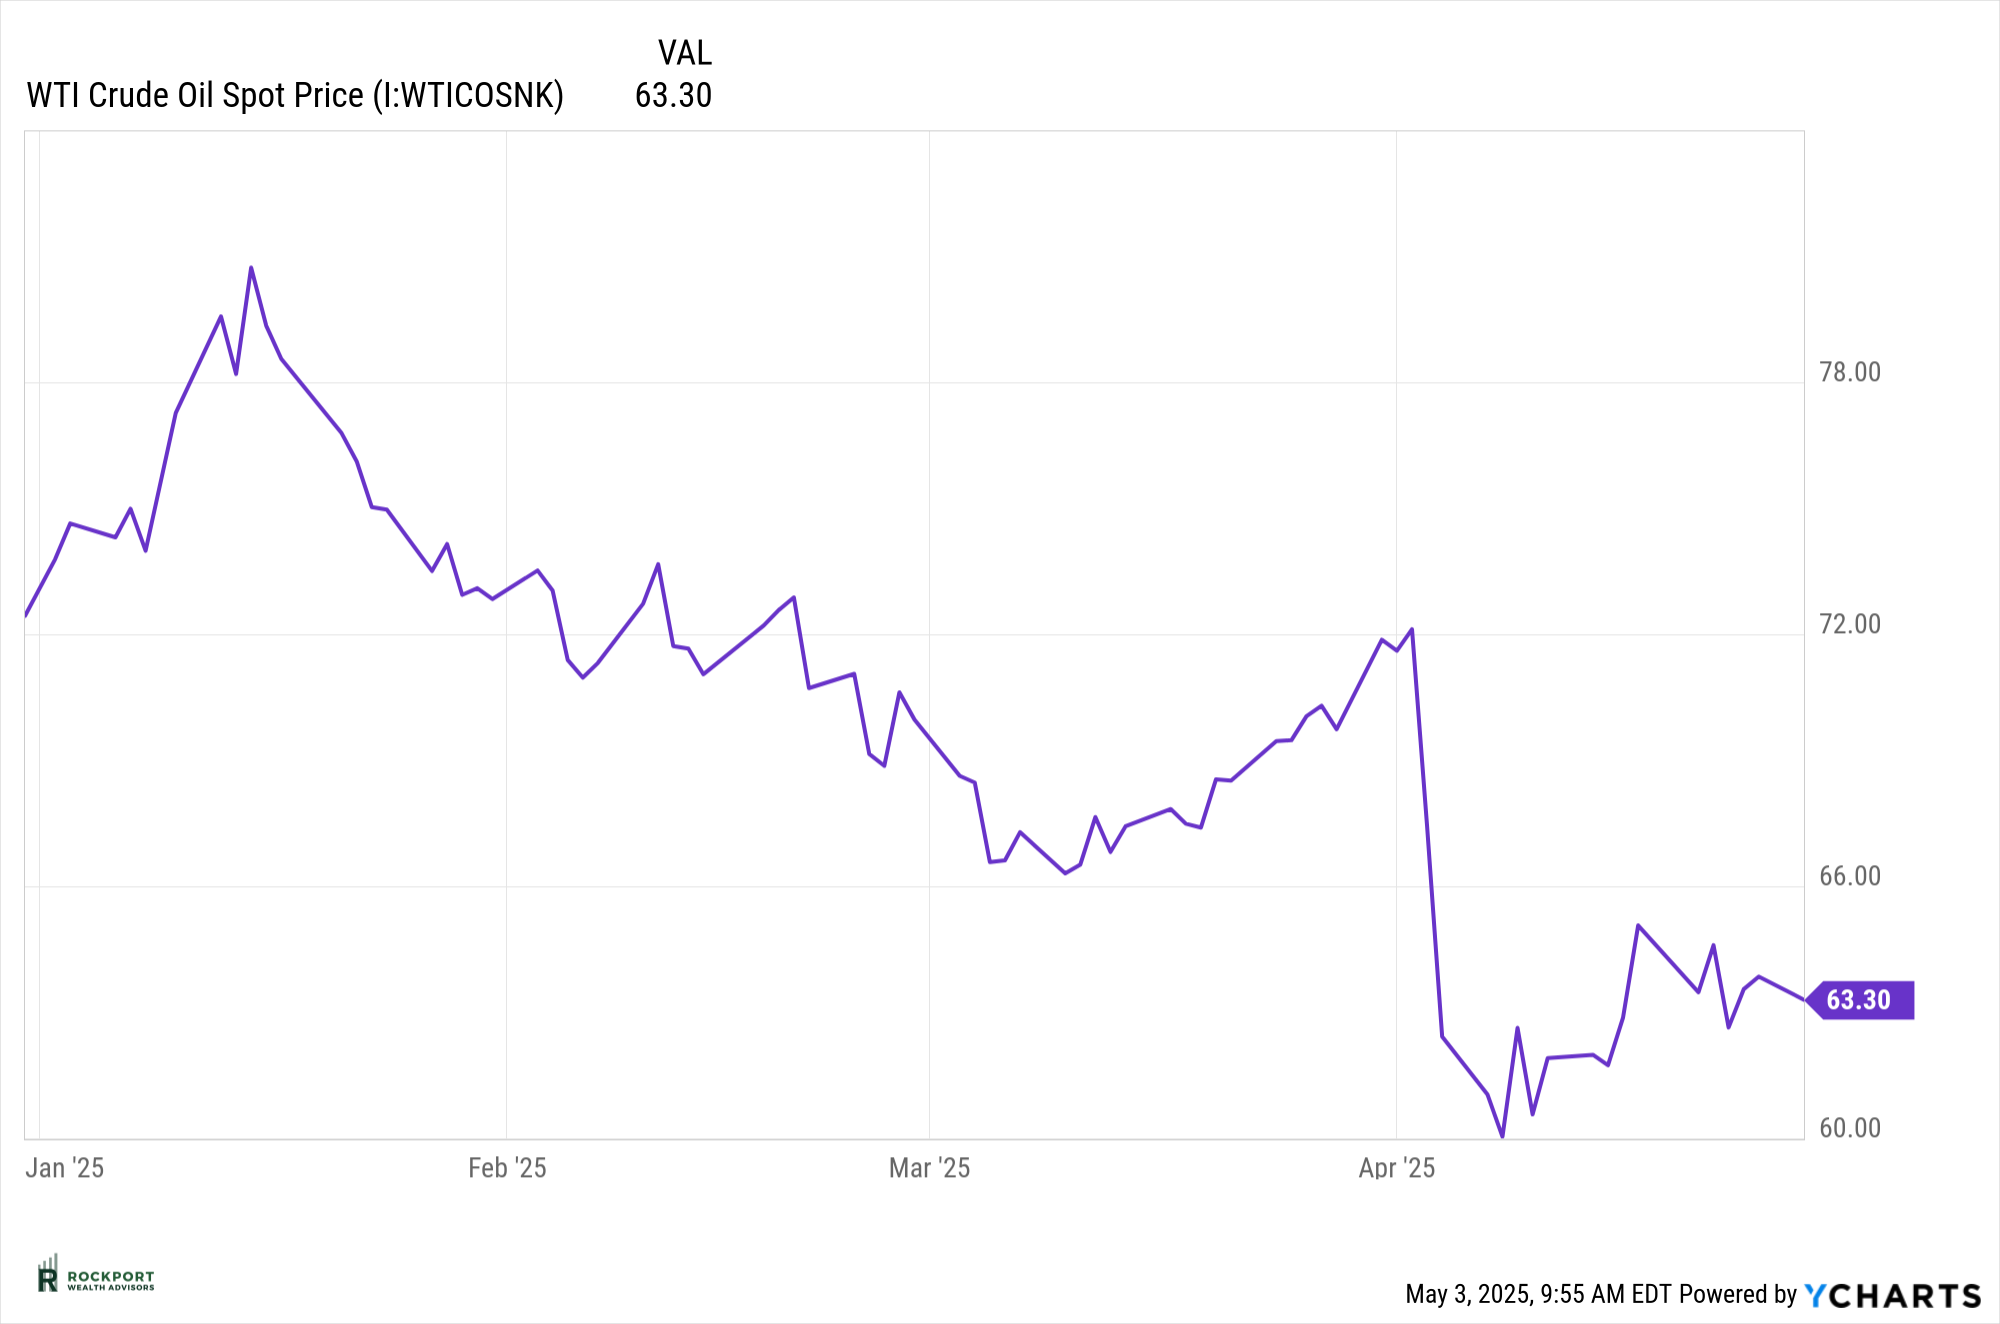
Oil prices have declined significantly this year—a development that typically signals easing inflationary pressures and could support the case for interest rate cuts by the Federal Reserve. Lower energy costs benefit consumers and businesses alike, often acting as a tailwind for broader economic activity.
However, the story isn’t entirely positive. A steep and sustained drop in oil prices can also be a symptom of weakening global demand, which ties into the broader narrative of slowing economic growth. While lower prices at the pump are generally welcome, a sharp decline in oil can raise concerns about the outlook for future economic expansion.
In short, falling oil prices are helping to tame inflation in the near term, but they also serve as a potential warning sign of softer growth ahead—another important data point we’re watching closely.
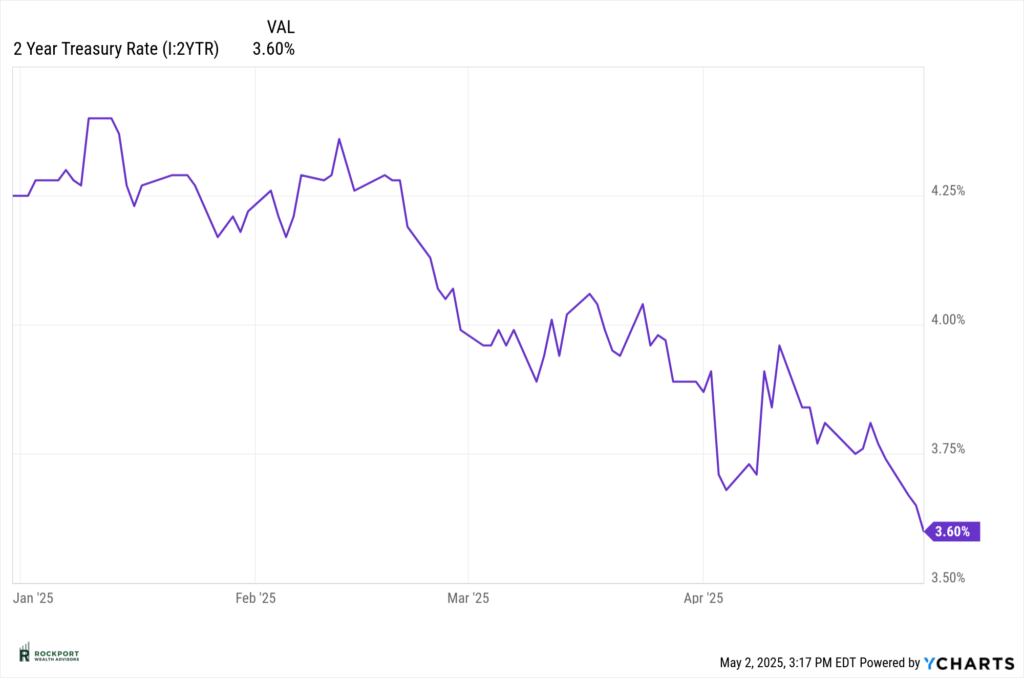
The current yield on the 2-Year Treasury stands at 3.6%, notably below the Federal Funds Rate, which remains in the 4.25% to 4.50% range. This inverted spread is often interpreted as a market signal that investors expect the Fed to begin cutting rates in the near future.
This puts Federal Reserve Chair Jerome Powell in a challenging position. On one hand, maintaining higher rates could help push inflation down further. On the other, cutting rates too quickly could risk a resurgence in inflation—undoing the progress made over the past year. Striking the right balance between supporting growth and controlling inflation is no easy task.
As we’ve said before, this is not an enviable role, and the path forward remains uncertain. We’ll continue to monitor both policy decisions and market signals closely, adjusting our outlook and strategy as needed.
All of these factors—GDP, consumer confidence, inflation, oil prices, and interest rate expectations—are just pieces of a larger puzzle as we work to understand and navigate the markets in 2025. While tariff headlines and short-term volatility will undoubtedly continue to drive market sentiment in the near term, our focus remains on cutting through the noise to identify meaningful trends and relevant data points. We remain committed to a disciplined, long-term approach and will continue to assess the evolving landscape with a clear, objective perspective.
Rockport News
Axos Change
For those of you that have brokerage accounts at AXOS, we will be terminating our relationship with them by year end. We will be in contact with you mid-year to arrange for a transfer of accounts to our other clearing firm Charles Schwab.
Salute to Service Golf Outing
Our 5th Annual Salute to Service Golf outing is taking place August 11, 2025 at Red Tail Golf Club in Avon.
Rockport Wealth Advisors honors the service and sacrifice of America’s veterans by providing free financial education and tools to those who serve. We team up with established veteran support nonprofits such as the National Veterans Memorial and Museum and GallantFew that share the same vision to ensure military heroes excel once they return home. The Salute to Service Golf Outing is an extension of our philanthropic efforts for veterans.
Since 2021 the Salute to Service Golf Outing has raised more than $65,000 for our military veterans! If you are a golfer and want to join this years fun, use the link below to learn more and register. Donations are also greatly appreciated and can be made through the link. All are welcome!
Salute to Service Golf Registration
As always, if you have any questions on anything we have talked about here or anything else that is on your mind, please feel free to reach out.
*Treasury yields can be found at finance.yahoo.com.
*Charts produced at yCharts.com
*The LEI can be found at Conference-board.org
*Bonds can be found at https://www.bloomberg.com/markets/rates-bonds
*CME FedWatch Tool – CME Group
*University of Michigan Consumer Confidence found at SentimentTrader.com
*FRED Charts produced by Federal Reserve Bank St. Louis
*PMI Manufacturing and Services Indexes, and Consumer Confidence and Future Expectations at Conference-board.org
*Buffett Indicator produced at currentmarketvaluation.com
*Distribution of S&P 500 Returns found at Macrotrends.net
*S&P 500 forward P/E ratios can be found atBusinessinsider.com
*The Asset Managers Positioning Chart found at The Daily Shot
* Rockport Models – Please remember we are referencing our model portfolios, and your portfolio may differ from the models mentioned depending on your individual needs and circumstances.