We hope you all had a wonderful, safe and healthy Holiday Season with your families!
Markets & Economy
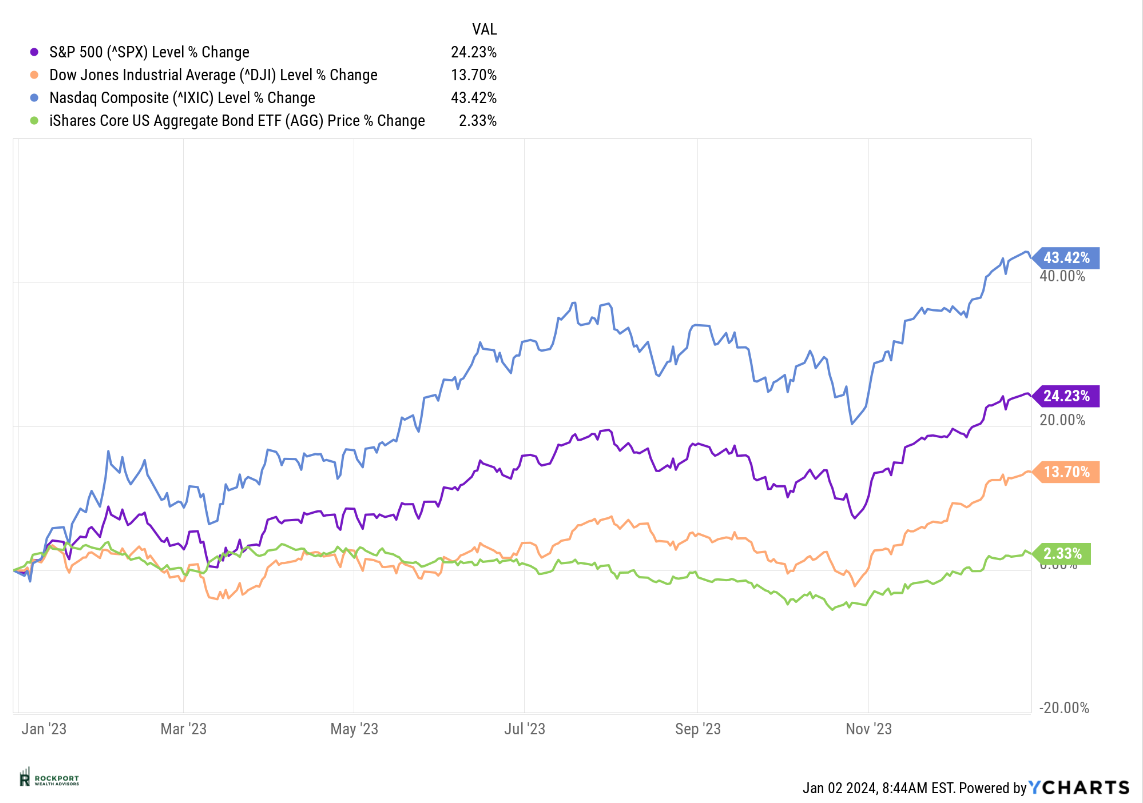
As the calendar turns, it’s often times beneficial to look back at the year that was as it helps frame the year to come. Describing the performance of the markets and economy throughout the year as resilient would be an understatement. At the beginning of the year, most stock market predictions anticipated ongoing declines, and economic forecasts hinted at a potential recession. However, both predictions proved to be significantly off the mark. The S&P 500 concluded the year with an impressive gain of 24.23%, and although the possibility of a recession lingered, it did not materialize.
Despite facing numerous challenges, such as the persistent conflict between Russia and Ukraine, a new Middle East crisis involving Israel, early-year interest rate hikes, lingering inflation exceeding the Federal Reserve’s comfort level, a regional banking crisis in the spring, and escalating geopolitical tensions globally, both the economy and the markets persevered. The period from August to October saw a market decline of slightly over 10%, introducing some discomfort even in a positive year. Nevertheless, a remarkable recovery ensued, contributing to the overall positive outcome of the year.
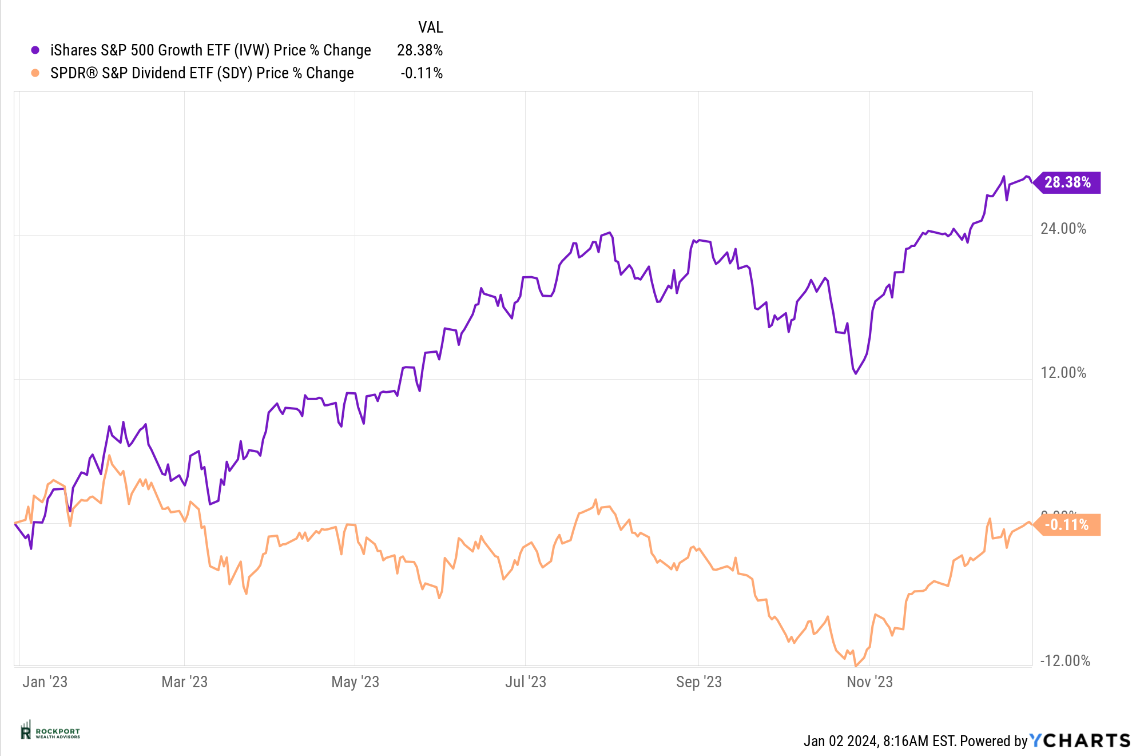
Notably, the recovery was comprehensive with various asset classes, including previously lagging sectors like bonds, experiencing substantial growth. The positive trend extended beyond the spotlighted “magnificent 7” stocks that had dominated discussions throughout the year. In summary, it turned out to be a favorable year for investors, marked by resilience and widespread gains across diverse market segments.
One area we all need to be careful of in terms of it relating to expectations is the phenomenon commonly referred to as groupthink, specifically focusing on the prevailing opinions within the analyst community. This exploration is crucial considering the historical inaccuracy of general consensus or group thinking in forecasting financial trends. Over the past two years, predictions suggested gains in 2022 and economic declines with a recession in 2023. However, reality defied these expectations, leading to outcomes contrary to the widely held beliefs.
While many anticipate further stock market gains and the absence of a recession in 2024, it’s essential to note that these opinions are not always accurate. We emphasize the tendency for outcomes to diverge from popular expectations. Let’s analyze the factual aspects without making definitive forecasts.
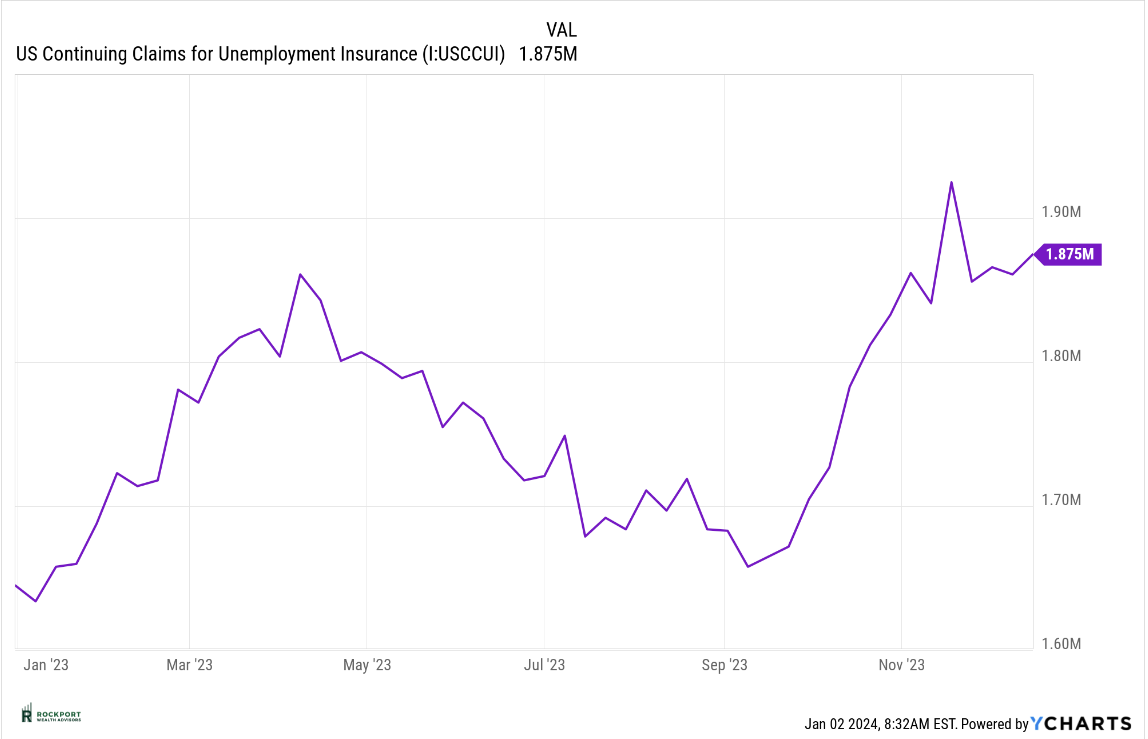
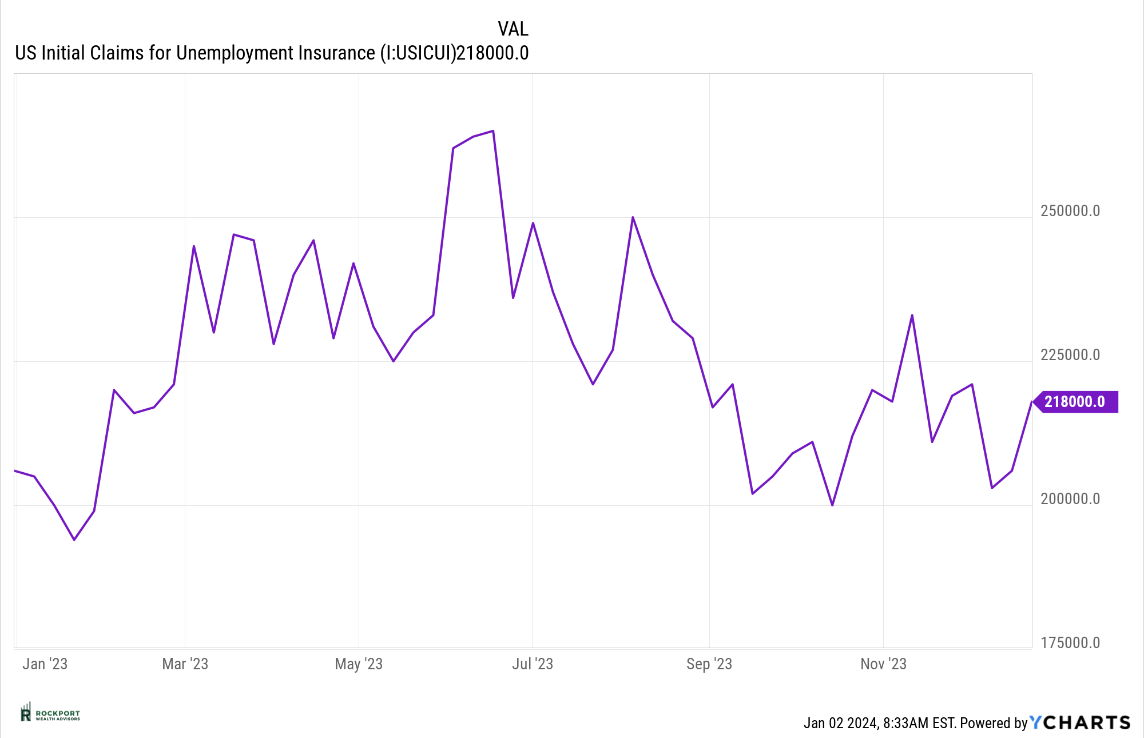
The rationale behind sustained growth in the equity market and the absence of a recession has primarily centered around robust employment and declining inflation. Although the unemployment rate remains impressively low, indicative of a strong labor market, there are signs that it might be cooling off. Job openings have declined, and layoffs have increased, warranting close observation as we navigate the new year.
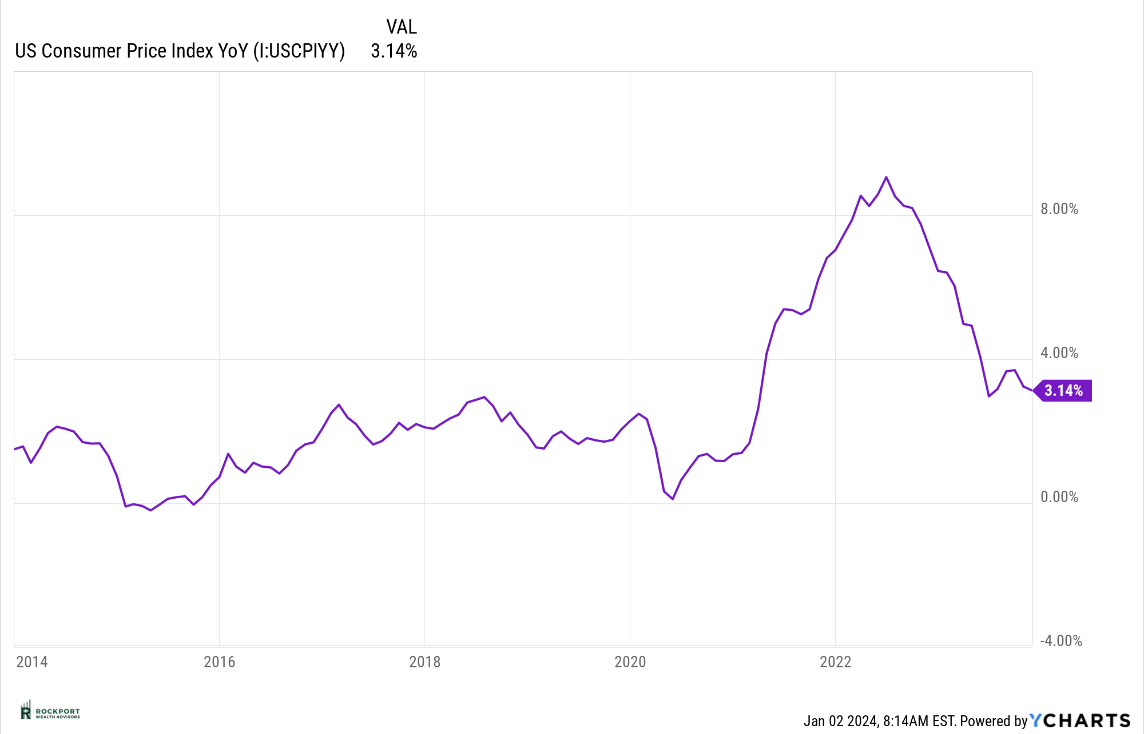
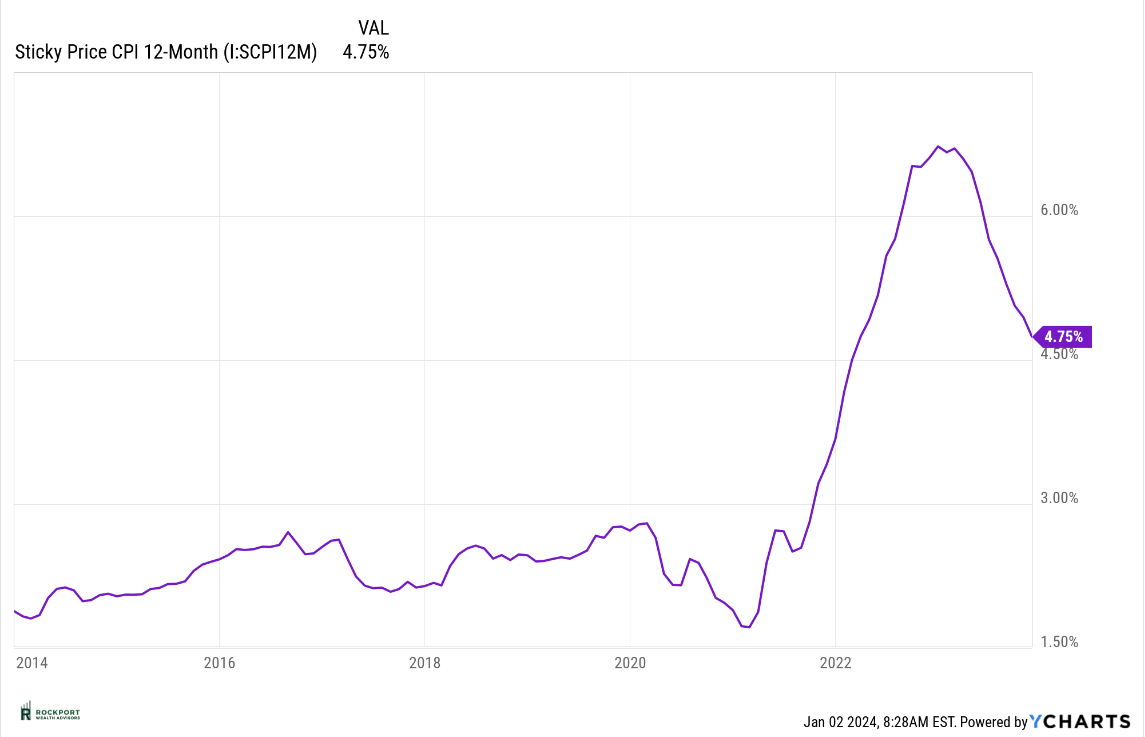
Concerning inflation, significant strides were made in 2023, with the Consumer Price Index (CPI) currently at 3.14%. While this marks a substantial improvement from the peak of over 9%, it appears that progress on the inflation front has hit a temporary standstill. Monitoring the trajectory of inflation becomes another crucial aspect to keep an eye on throughout the new year. The question remains: can the Federal Reserve continue making headway toward their 2% inflation target?
In regard to the Federal Reserve, the focal point for markets in 2024 will undoubtedly be interest rates once again. A significant area of interest lies in the current disparity between the stock market’s expectations regarding interest rates and the indications from the Federal Reserve. Presently, the market is factoring in six interest rate cuts for 2024, while the Fed suggests a more conservative estimate of around three cuts. Some argue that the robust market rally in November and December was fueled by expectations of rate cuts, aligning with the forward-looking nature of the market. However, there is a risk that if the Fed diverges from the market’s expectations, the market could react inversely to the trends observed in the closing months of 2023. Additionally, from our perspective, the scenario of witnessing six interest rate cuts would likely only materialize if we enter a recession, prompting the Fed to implement multiple cuts to stimulate economic expansion.
As we step into 2024, we find ourselves navigating through a heightened sense of uncertainty that goes beyond the norms we’ve grown accustomed to. Geopolitical risks are currently at their peak, contributing to an environment where global stability feels more precarious than it has in quite some time. A significant concern on the horizon is the burgeoning US Debt, which appears to be receiving less attention than its potential impact warrants. The implications of this situation are uncertain, and we are closely monitoring developments. Another noteworthy aspect is the state of the consumer, who has wielded considerable influence through consistent spending in recent years. However, signs suggest a potential shift, with credit card balances reaching record highs and delinquencies in both credit card and auto payments at their highest since 2008. This raises questions about the consumer’s endurance in sustaining the economy through spending. In the realm of investing and economics, not every scenario adheres to a straightforward logic or seems to make immediate sense. We believe we are currently navigating one of those times.
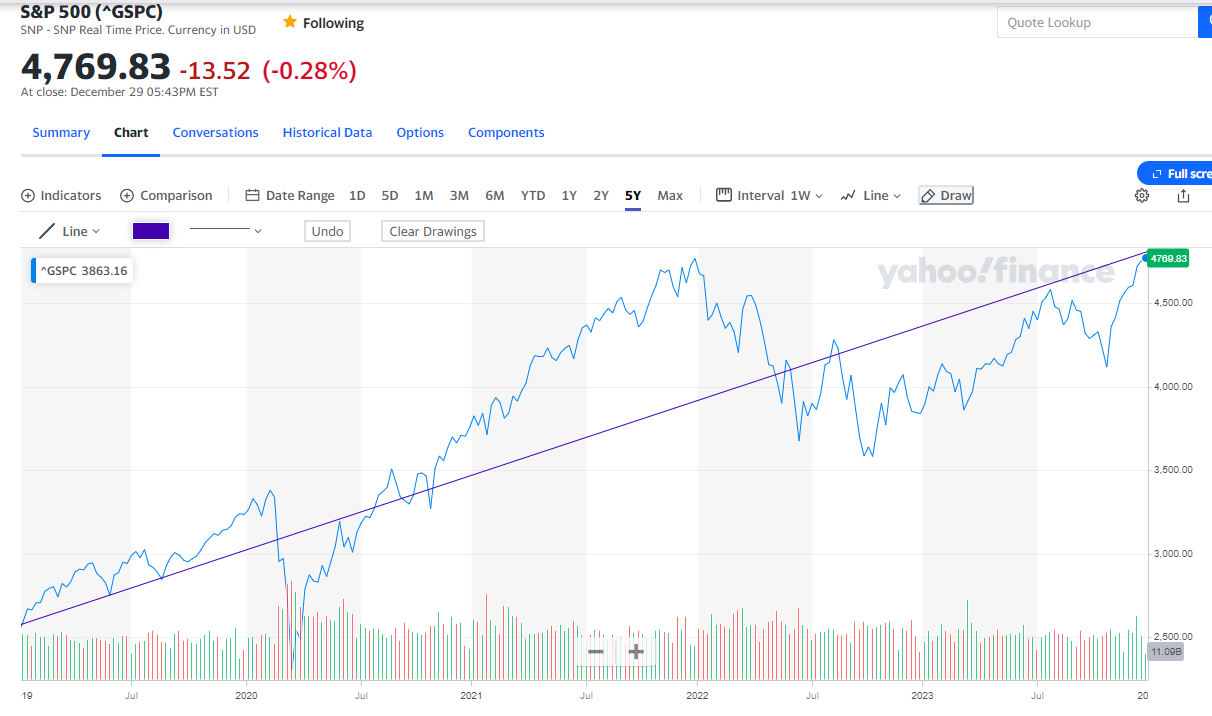
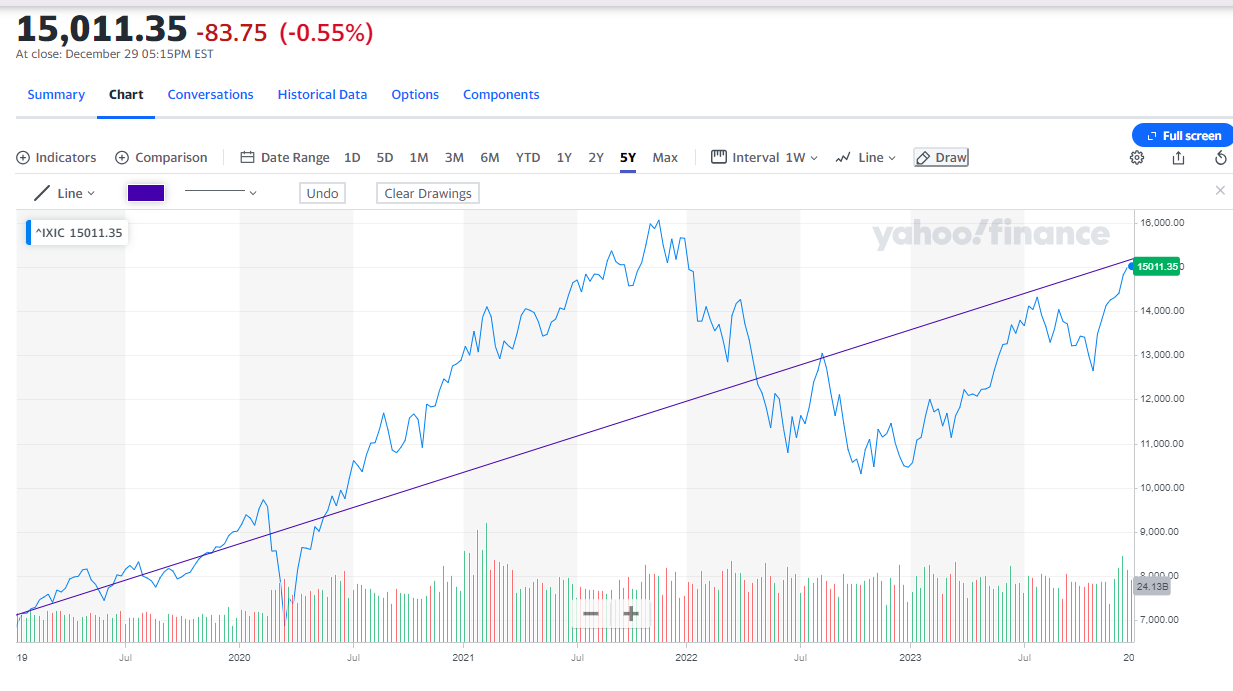
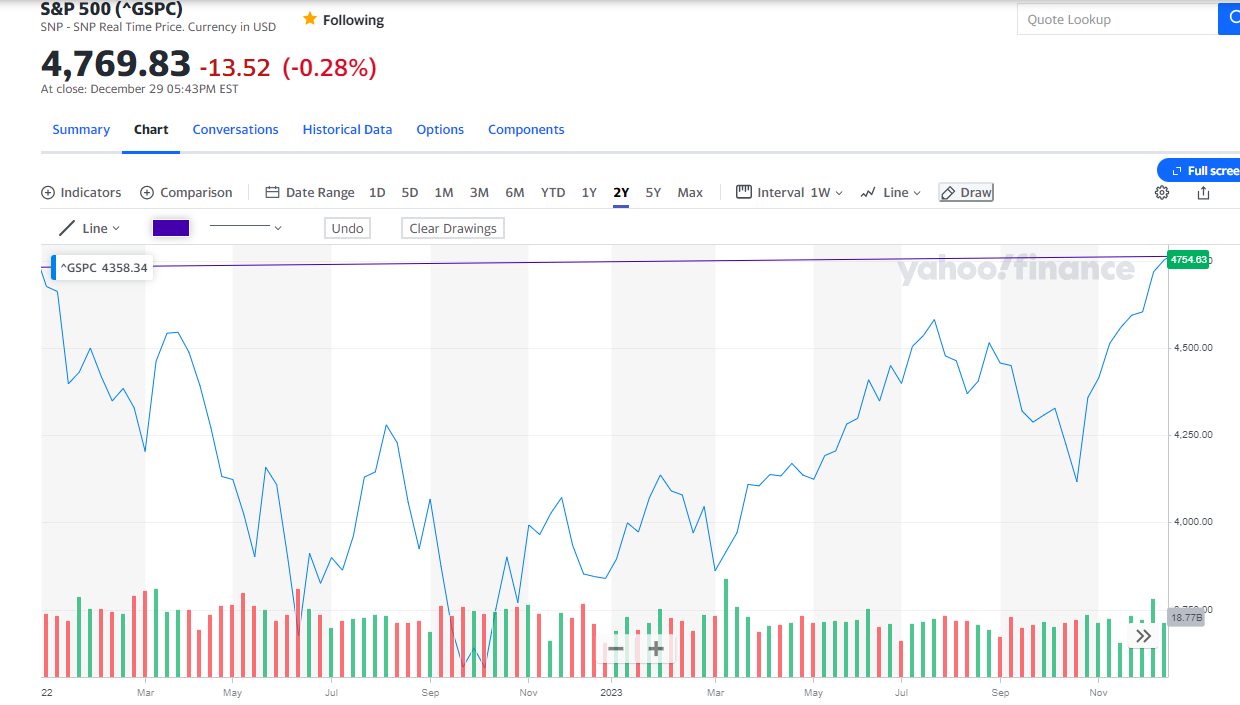
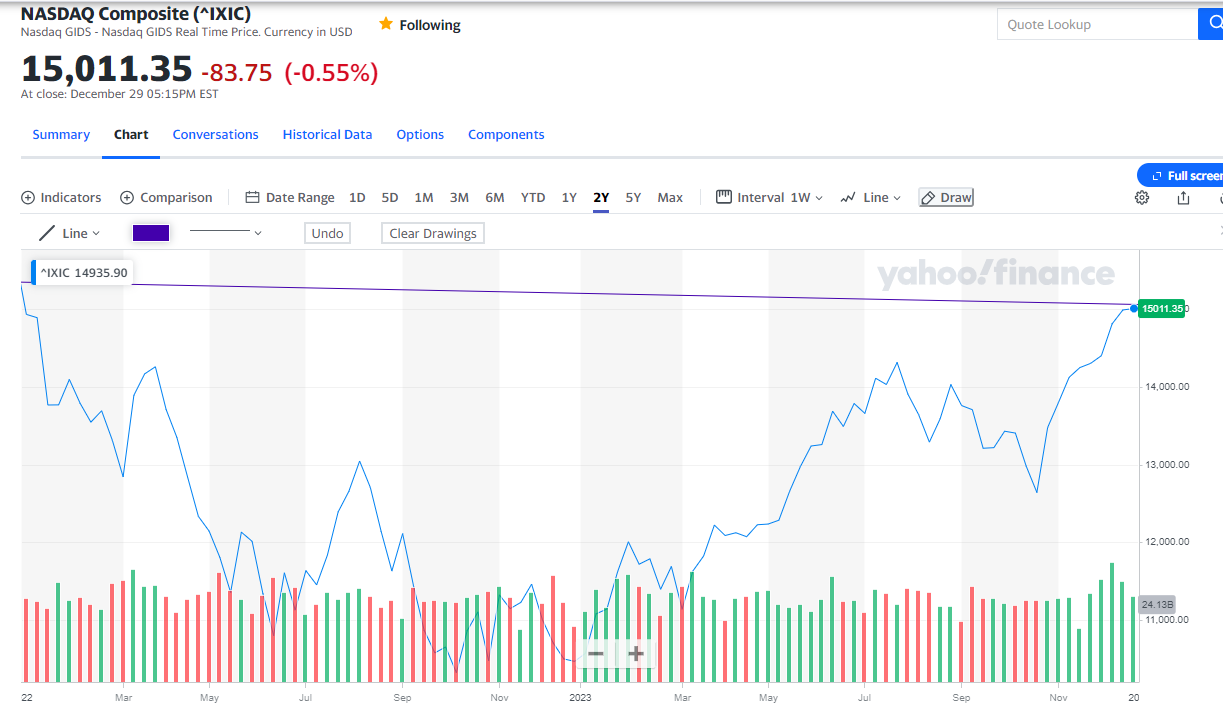
Finally, let’s reflect on the market’s performance over the past two years. Refer to the S&P 500 and NASDAQ charts below. Despite a strong showing last year, the overall gains for the S&P 500 over the last two years are marginal, and the NASDAQ has yet to fully recover from its 2022 losses. The key factors here are timing and perspective. Those who began investing in the fall of 2022 are likely delighted, while those who started or were already invested at the beginning of 2022 are just now approaching a break-even point. Time proves to be a valuable ally, as evident from the 5-year charts. Investing throughout the entire 5-year period has resulted in commendable returns.
We took a break from a lot of the normal charts we have followed over the past year in this year-end newsletter, but will reintroduce those next month and continue to follow them as long as they remain relevant.
As always, if you have any questions on anything we have talked about here or anything else that is on your mind, please feel free to reach out.
*The Standard & Poor’s 500 (S&P 500) is an unmanaged group of securities considered to be representative of the stock market in general. Results can be found at slickcharts.com.
*Treasury yields can be found at finance.yahoo.com.
*Charts produced at yCharts.com
*Bonds can be found at bloomberg.com/markets/rates-bonds
*Fed Rate Probability Chart can be found at cmegroup.com/markets/interest-rates/cme-fedwatch-too
*The LEI can be found at conference-board.org/topics/us-leading-indicators
*Treasury Yield Curve can be found at Gurufocus.com
*Rockport Models – Please remember we are referencing our model portfolios, and your portfolio may differ from the models mentioned depending on your individual needs and circumstance.


