Markets Pullback
The markets in the month of February were down, but this was not a terribly surprising event given the amount of the advance that had taken place in January. For the month, the S&P 500 index was down – 2.61%, however the index remains up 3.4% year to date. It has still been a nice start to the year. The other major indexes have followed similar patterns for the year. An interesting observation has been that thus far this year, the things that were down the most in 2022 seem to be up the most in 2023. Again, not terribly surprising based on past history of market movements and behavior. Markets have no doubt been trying to find any silver lining possible and are clearly hoping the Fed will stop increasing rates and possibly cut rates later this year. Hence the strength to start the year.
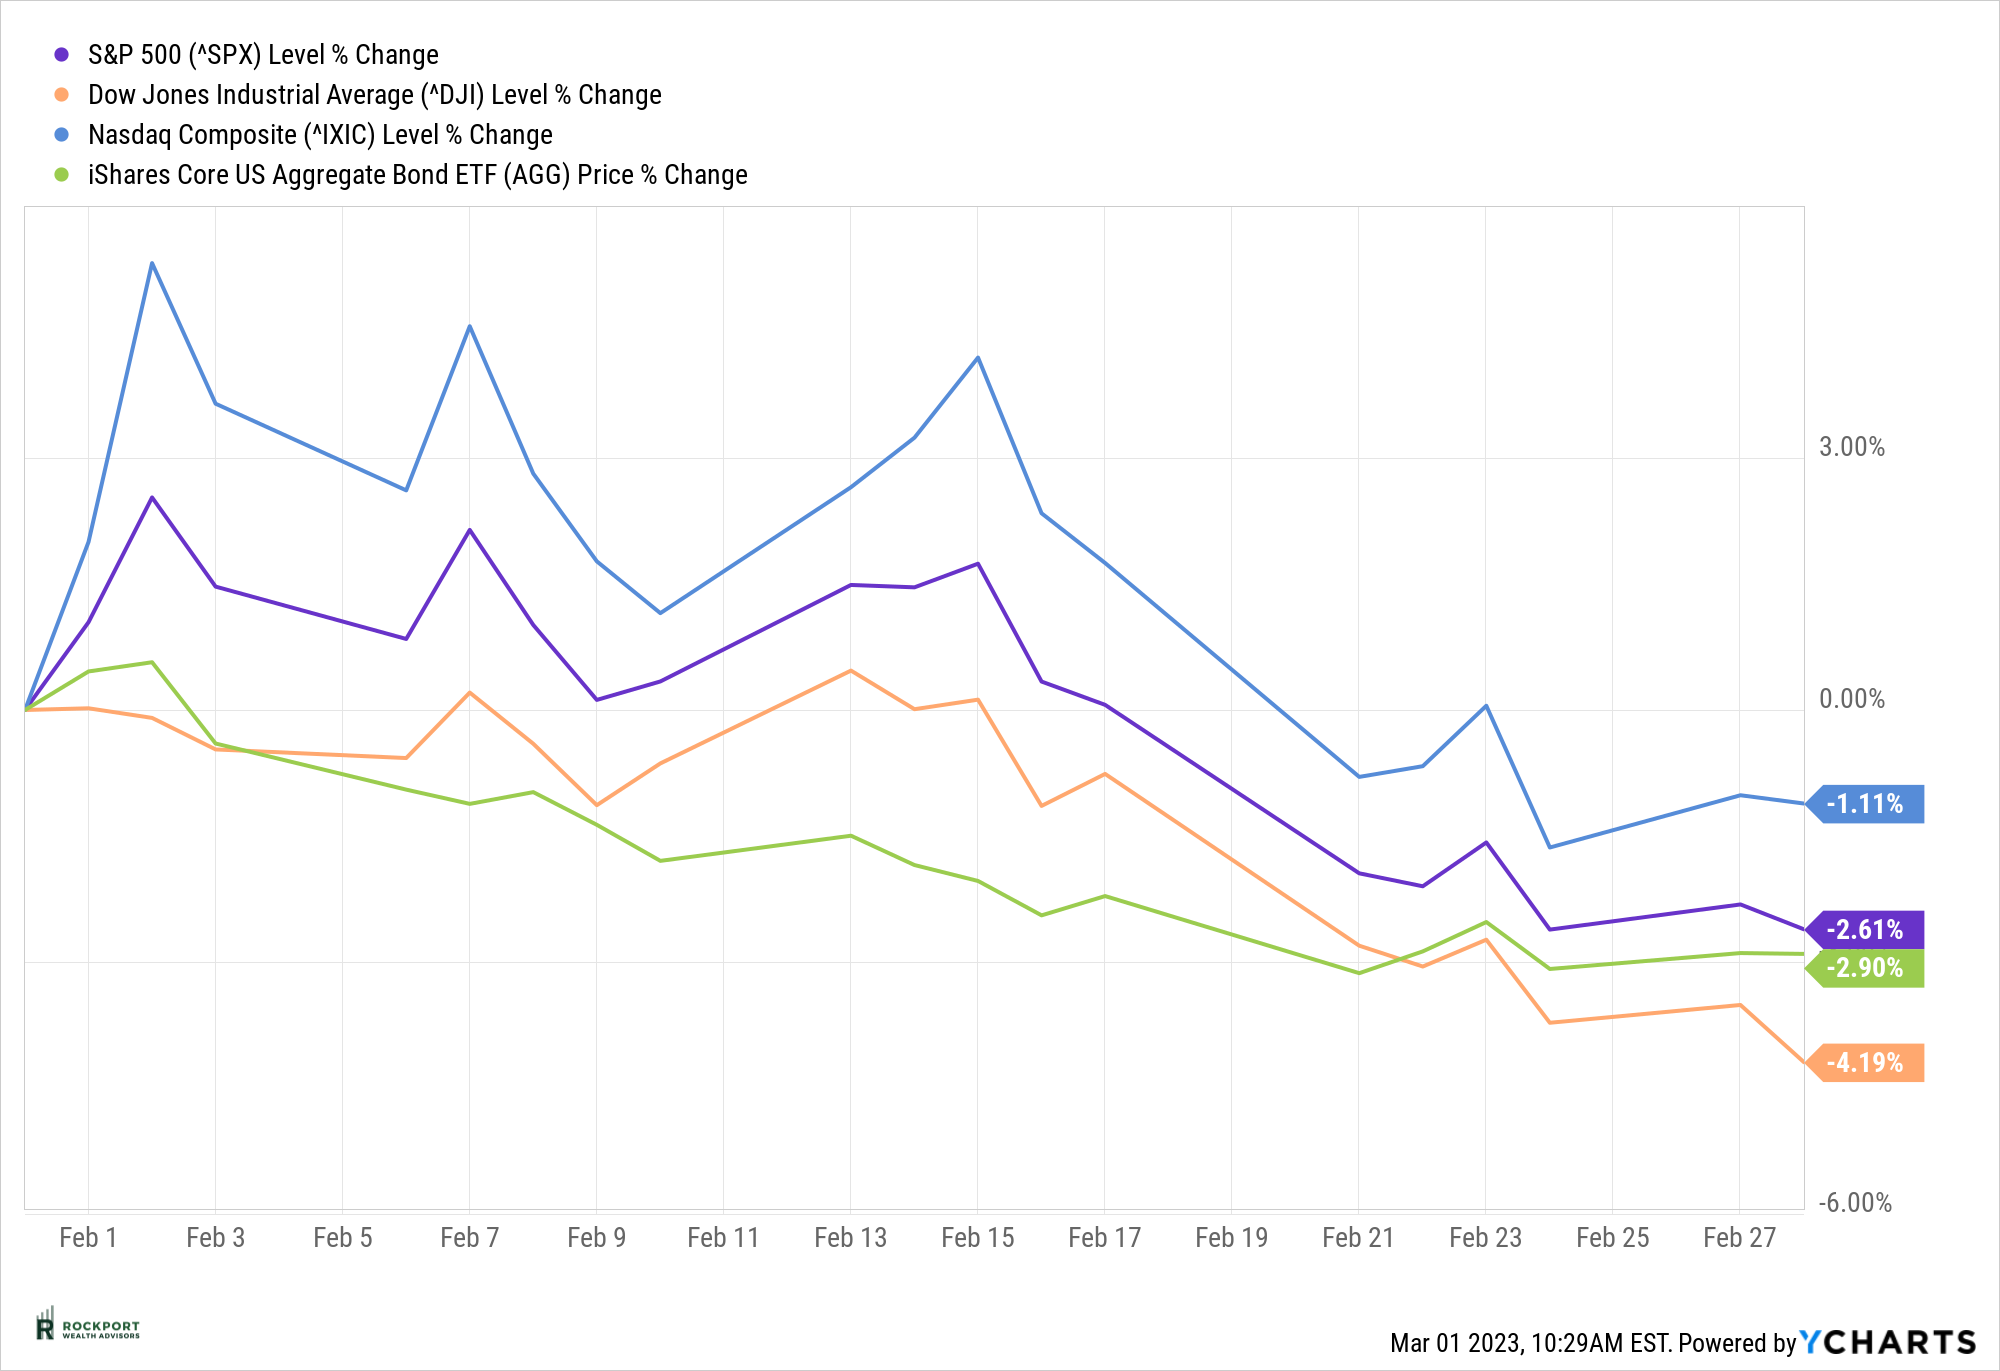
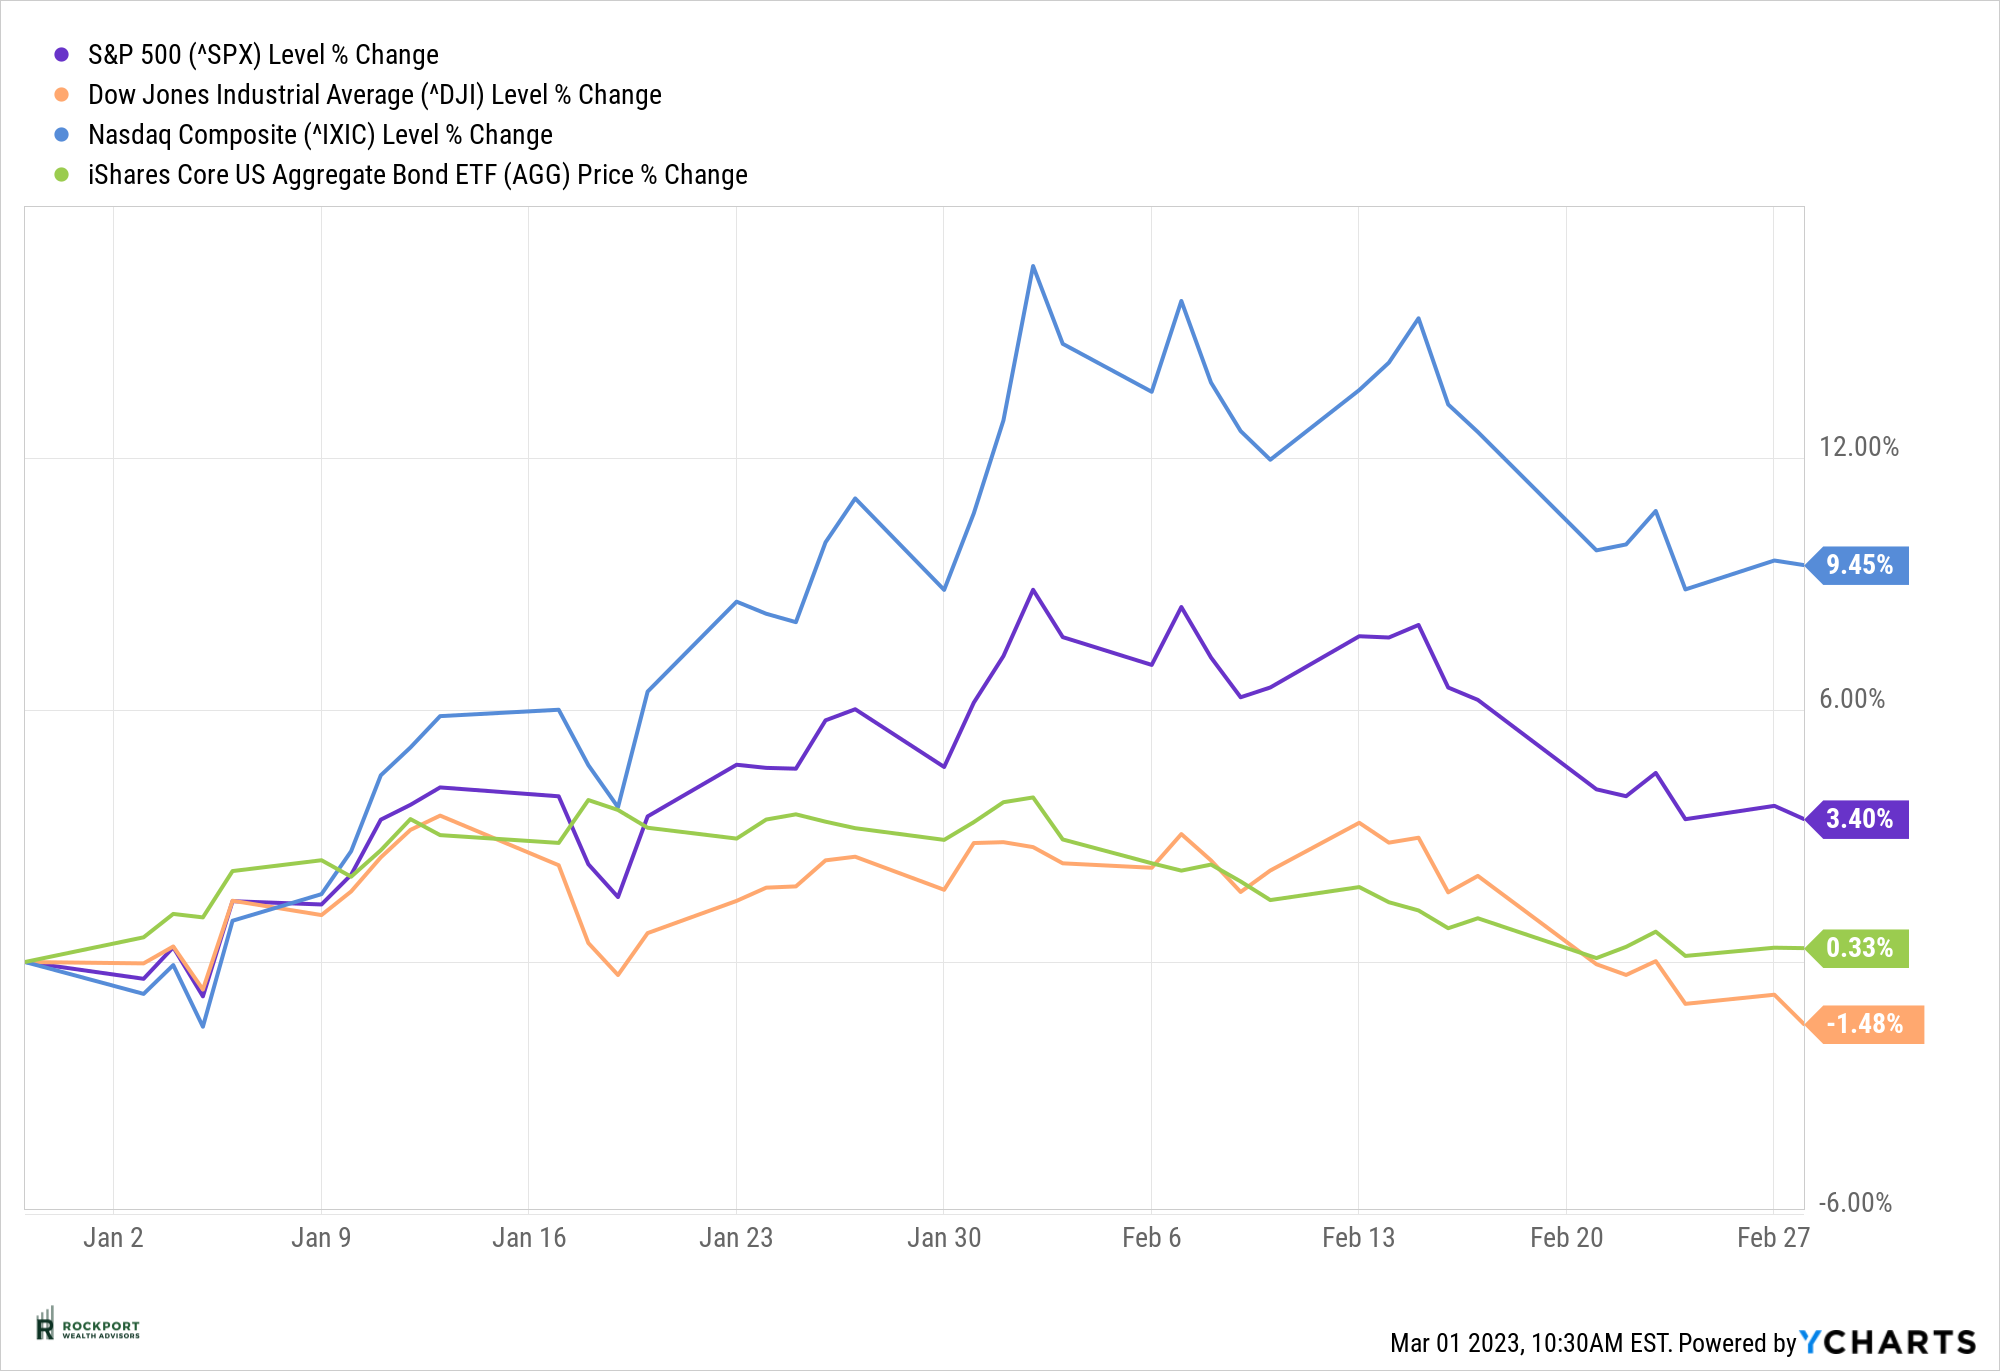
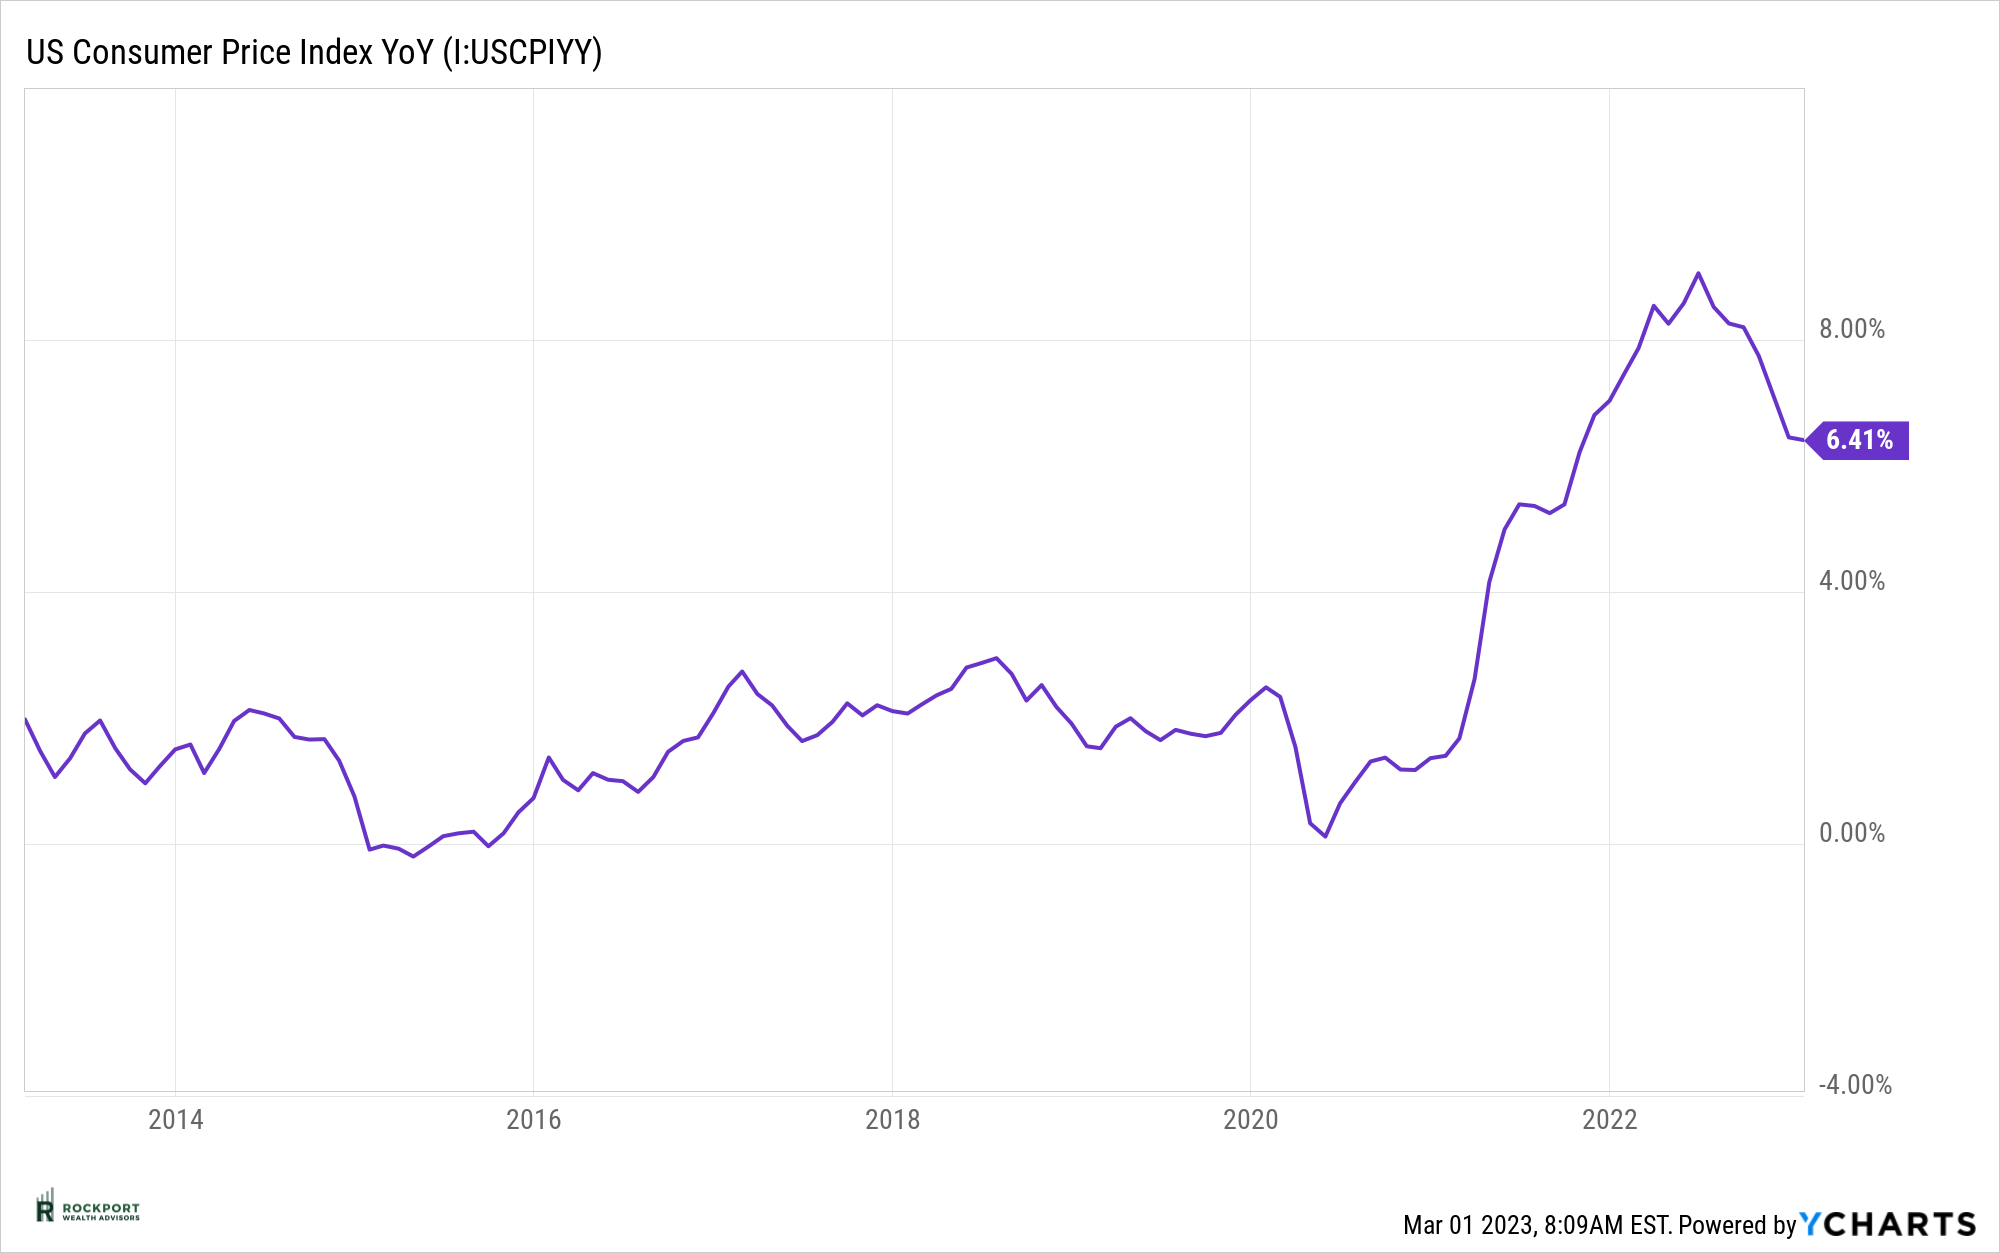
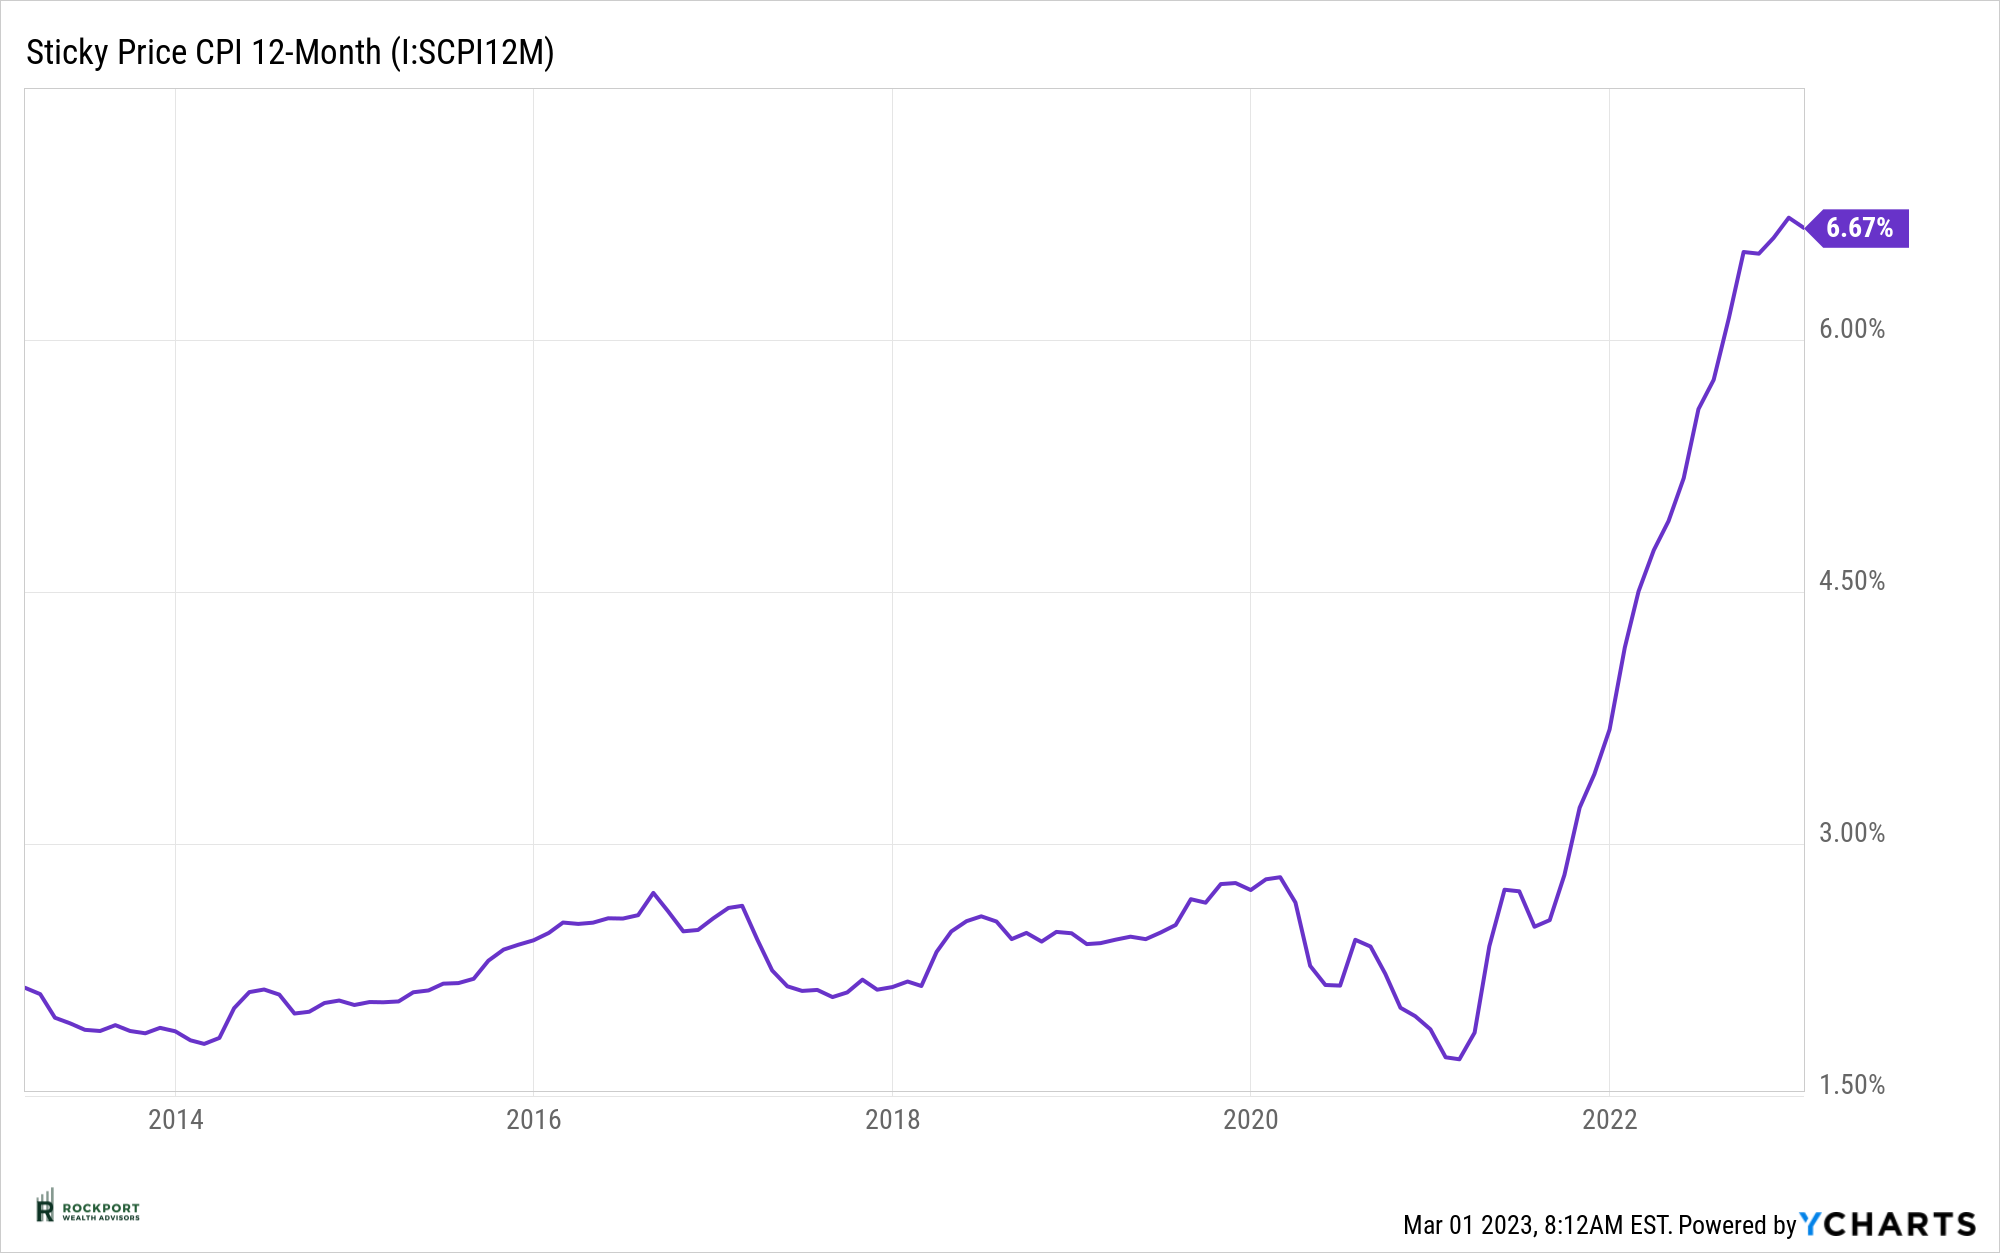
Of course, the story has not changed as the markets continue to ride on the coat tales of the Federal Reserves every move and comment. Inflation continues to surprise the experts to the upside. This month we are going to put a little different spin on the inflation story in hopes of clarifying where the Fed’s thoughts might lie. As you can see from the first chart below the CPI (Consumer Price Index) has continued to come down and the most recent reading has fallen to plus 6.41% year over year. This is considerably off the high which was over 9% in mid-2022, but far from the 2% inflation rate which is the Fed’s goal. Nevertheless, it’s making progress in the right direction. However, this may not be telling the whole story. A closer look at what is called “Sticky CPI” shows a number of 6.67% (See 2nd chart below). This number has barely budged to the downside. What is sticky CPI? Sticky CPI consists of items that tend to have price changes that are much slower and more infrequent. Some examples of this are medical services, education, and most housing categories. Since this number is not falling, it may give the Fed more fuel to continue to increase rates for longer and this may in fact be what they are focusing on more than the standard CPI.
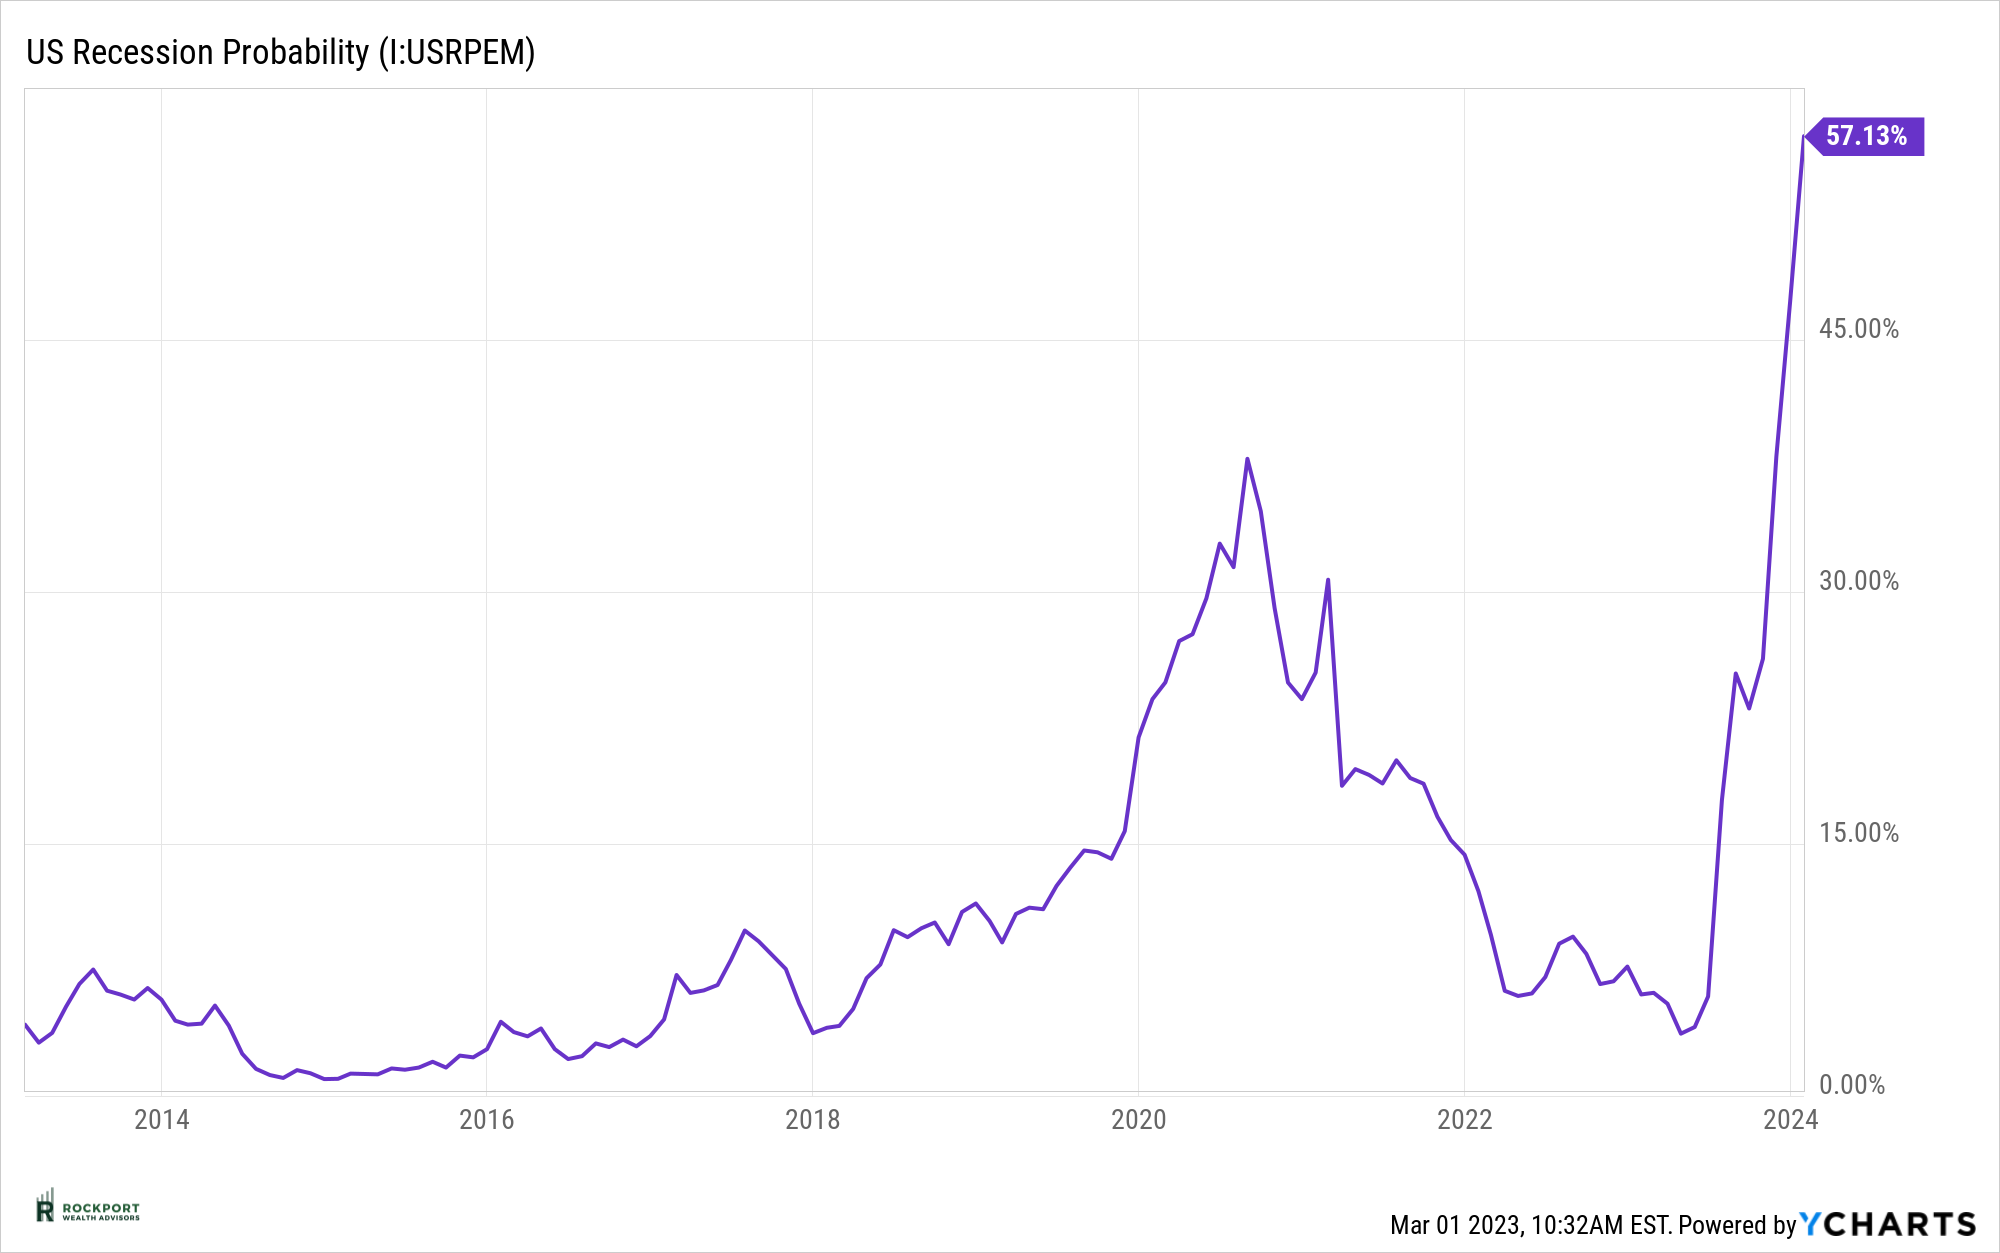
As a side note, the Federal Reserve bank of New York’s recession probability model (see chart 3 below) has increased to 57.13%. Long story short, it’s probably going to be tough for the market to get a lot of traction as long as the above trends continue.
One change that has been very noticeable over the past year is the interest one can now earn on cash and cash equivalents. A year ago, money markets were barely getting interest, today we have money market availability over 4% and Treasury Bills especially shorter duration ones have gone from under 1% a year ago to in some cases over 5% yields today. We have had many conversations with clients about idle cash and utilizing these tools to improve their cash returns. If this is something you would like more information on please reach out!
Public Service Announcement 😊 Unfortunately the world is a dishonest place. We have had a few clients mention attempts by hackers through email and text to obtain their personal and financial information. Please be diligent and don’t click on any mysterious links or texts. If you are not sure about something you receive via email in particular please feel free to reach out to us.
Lastly, Tax season is upon us. If you have not received all of your tax forms or are unsure if you have received all of them please give us a call. In most cases we have the tax forms in PDF format. At the very least we can put in a request on your behalf to obtain the forms.
As always, if you have any questions on anything we have talked about here or anything else that is on your mind, please feel free to reach out.
*The Standard & Poor’s 500 (S&P 500) is an unmanaged group of securities considered to be representative of the stock market in general. Results can be found at slickcharts.com.
*Treasury yields can be found at finance.yahoo.com.
*Charts produced at yCharts.com
*Bonds can be found at bloomberg.com/markets/rates-bonds

