Finally! A nice month for the stock market as we closed out the month with the S&P 500 up just over 9% for the month which puts the index down 13.3% for the year. This was the best month we have had since March and one of only a couple positive months this year.
Inflation and the federal reserve still remain the hot topics and that story has not changed. As we have stated multiple times, The Federal reserve is attempting to control inflation and one of their primary tools to accomplish this is through interest rate increases. Here is a brief timeline of how the last 12 months have played out in Federal Reserve/Interest Rate world:
Summer 2021 – Fed states “No rate increases until 2023”
End of year 2021 – Fed anticipates 2 rate increases in 2022
March 2022 – First rate increase of .25% and oh by the way Fed announces they are anticipating 7 more increases
May 2022 – Second Rate increase this year .50% (almost no mention of more than a .25% increase prior)
June 2022 – Third Rate increase this year .75% (almost no mention of more than a .50% increase prior)
July 2022 – Fourth Rate Increase this year .75% (There was discussion of raising 1%)
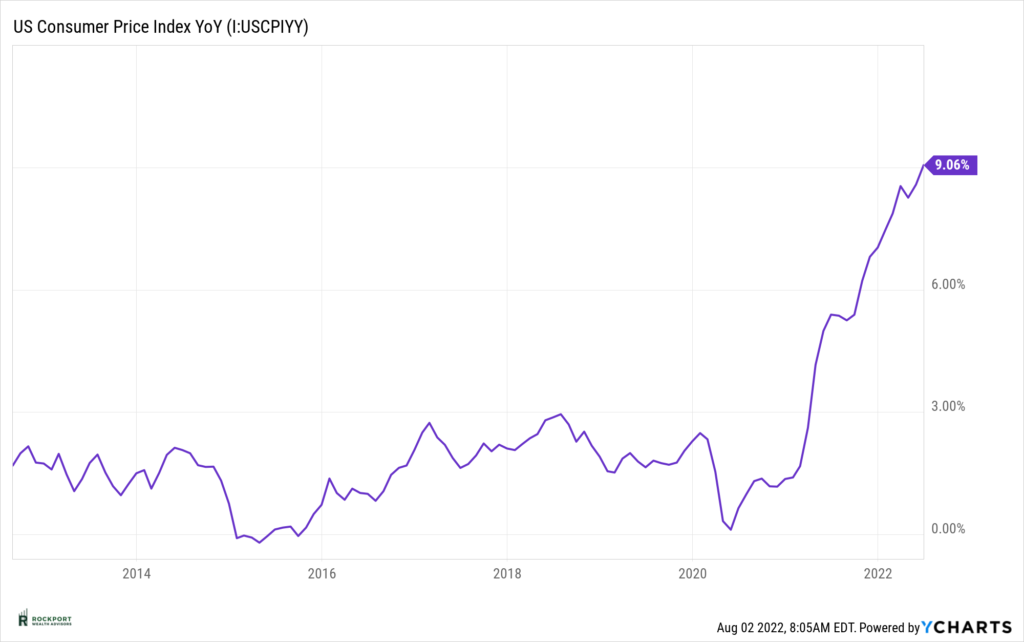
We show this timeline to help illustrate how tough of an art it is to forecast interest rate movements and how quickly things can change and as a back up to one of the main reasons stock and bond markets are struggling this year. In short, it’s tough for the markets to arrive at an end conclusion if the Fed is having a tough time determining their ending point on rate increases. Many questions remain to be answered in 2022. How much more will the Fed increase interest rates? Will The CPI begin to fall? (See chart) Will the Fed throw the economy into a deep recession by virtue of the slowing effect from interest rate hikes? Are we in a recession already and if so how deep will it be? (Note: Just prior to the release of this newsletter GDP (Gross Domestic Product) for the 2nd quarter was released and was -.9% after a negative first quarter GDP release the text book definition of a recession has been met which is 2 consecutive negative quarters of GDP however, with employment so high it would be one of the strangest recessions on record.) As you can see uncertainty is high and one thing we know for sure is that nobody knows the answers to any of the above at this point. With the amount of time it takes for interest rate hikes to filter through the system, the full effect of what the fed is doing will likely not be felt until Fall and Winter.

We have received a lot of questions about portfolio performance (Understandably) and has we have briefly alluded to in the past stocks being down is not terribly surprising to us but the magnitude of the decline in the bond market has been. On average the S&P 500 experiences a down year about 1 out of every 4 years. For the most part recently, declining years have not been that deep or have been very short lived and the last major decline was in 2008. Bonds on the other hand have had negative returns only about 1 year out of every 10 and appear to be heading for back-to-back losing years as 2021 was down fractionally. We state these facts for a couple reasons. First, market decline are not as uncommon as the media may make them sound and second, this has been a year (so far) where almost everything has been in decline. This is especially tough on conservative investors. Most stock heavy investors have come to realize that bad years occur in stocks and that the good years far outweigh the bad years.
Conservative investors are conservative for a reason and that reason is they are not comfortable with the more significant ups and downs of a stock heavy portfolio. This has been a tough situation for both us and clients and unfortunately there is no quick/easy fix. The saying Tim heals all wounds comes to mind.
As always if you have questions or would like to review your personal situation, please feel free to reach out. Enjoy summer! Time fly’s and before we know it snow will be flying to for those of us in the North.
*The Standard & Poor’s 500 (S&P 500) is an unmanaged group of securities considered to be representative of the stock market in general. Results can be found at slickcharts.com.
*Treasury yields can be found at finance.yahoo.com.
*Charts produced at yCharts.com

