We hope this month’s newsletter finds you all well and you are enjoying watching Team USA at the Olympics this summer. We probably say this every year but it’s amazing how quick the year has gone by.
Markets & Economy
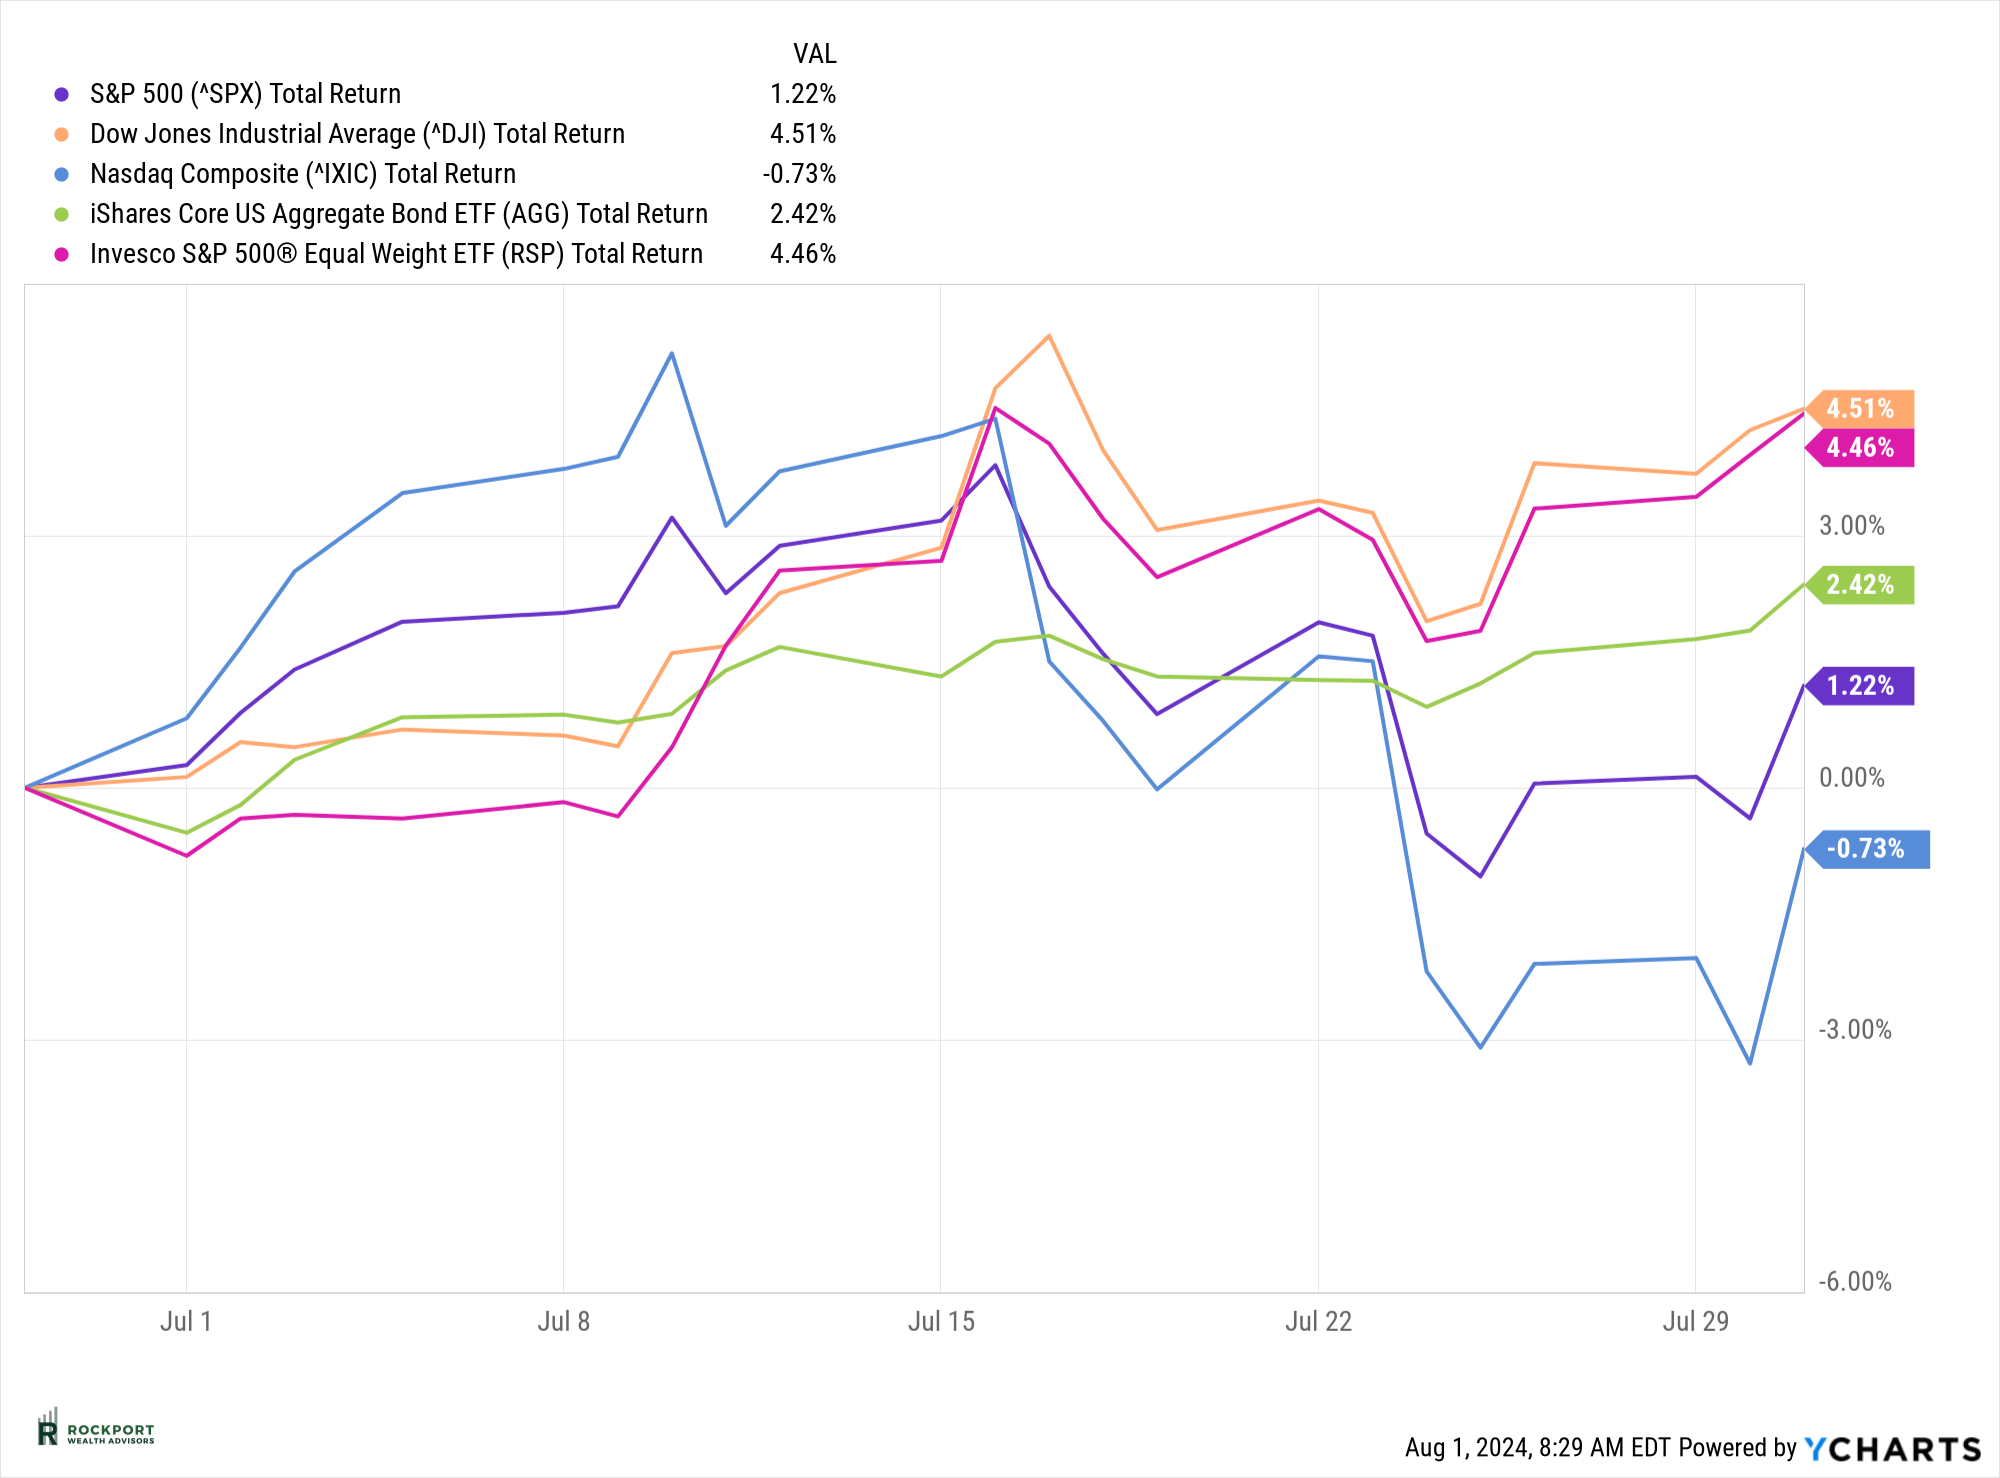
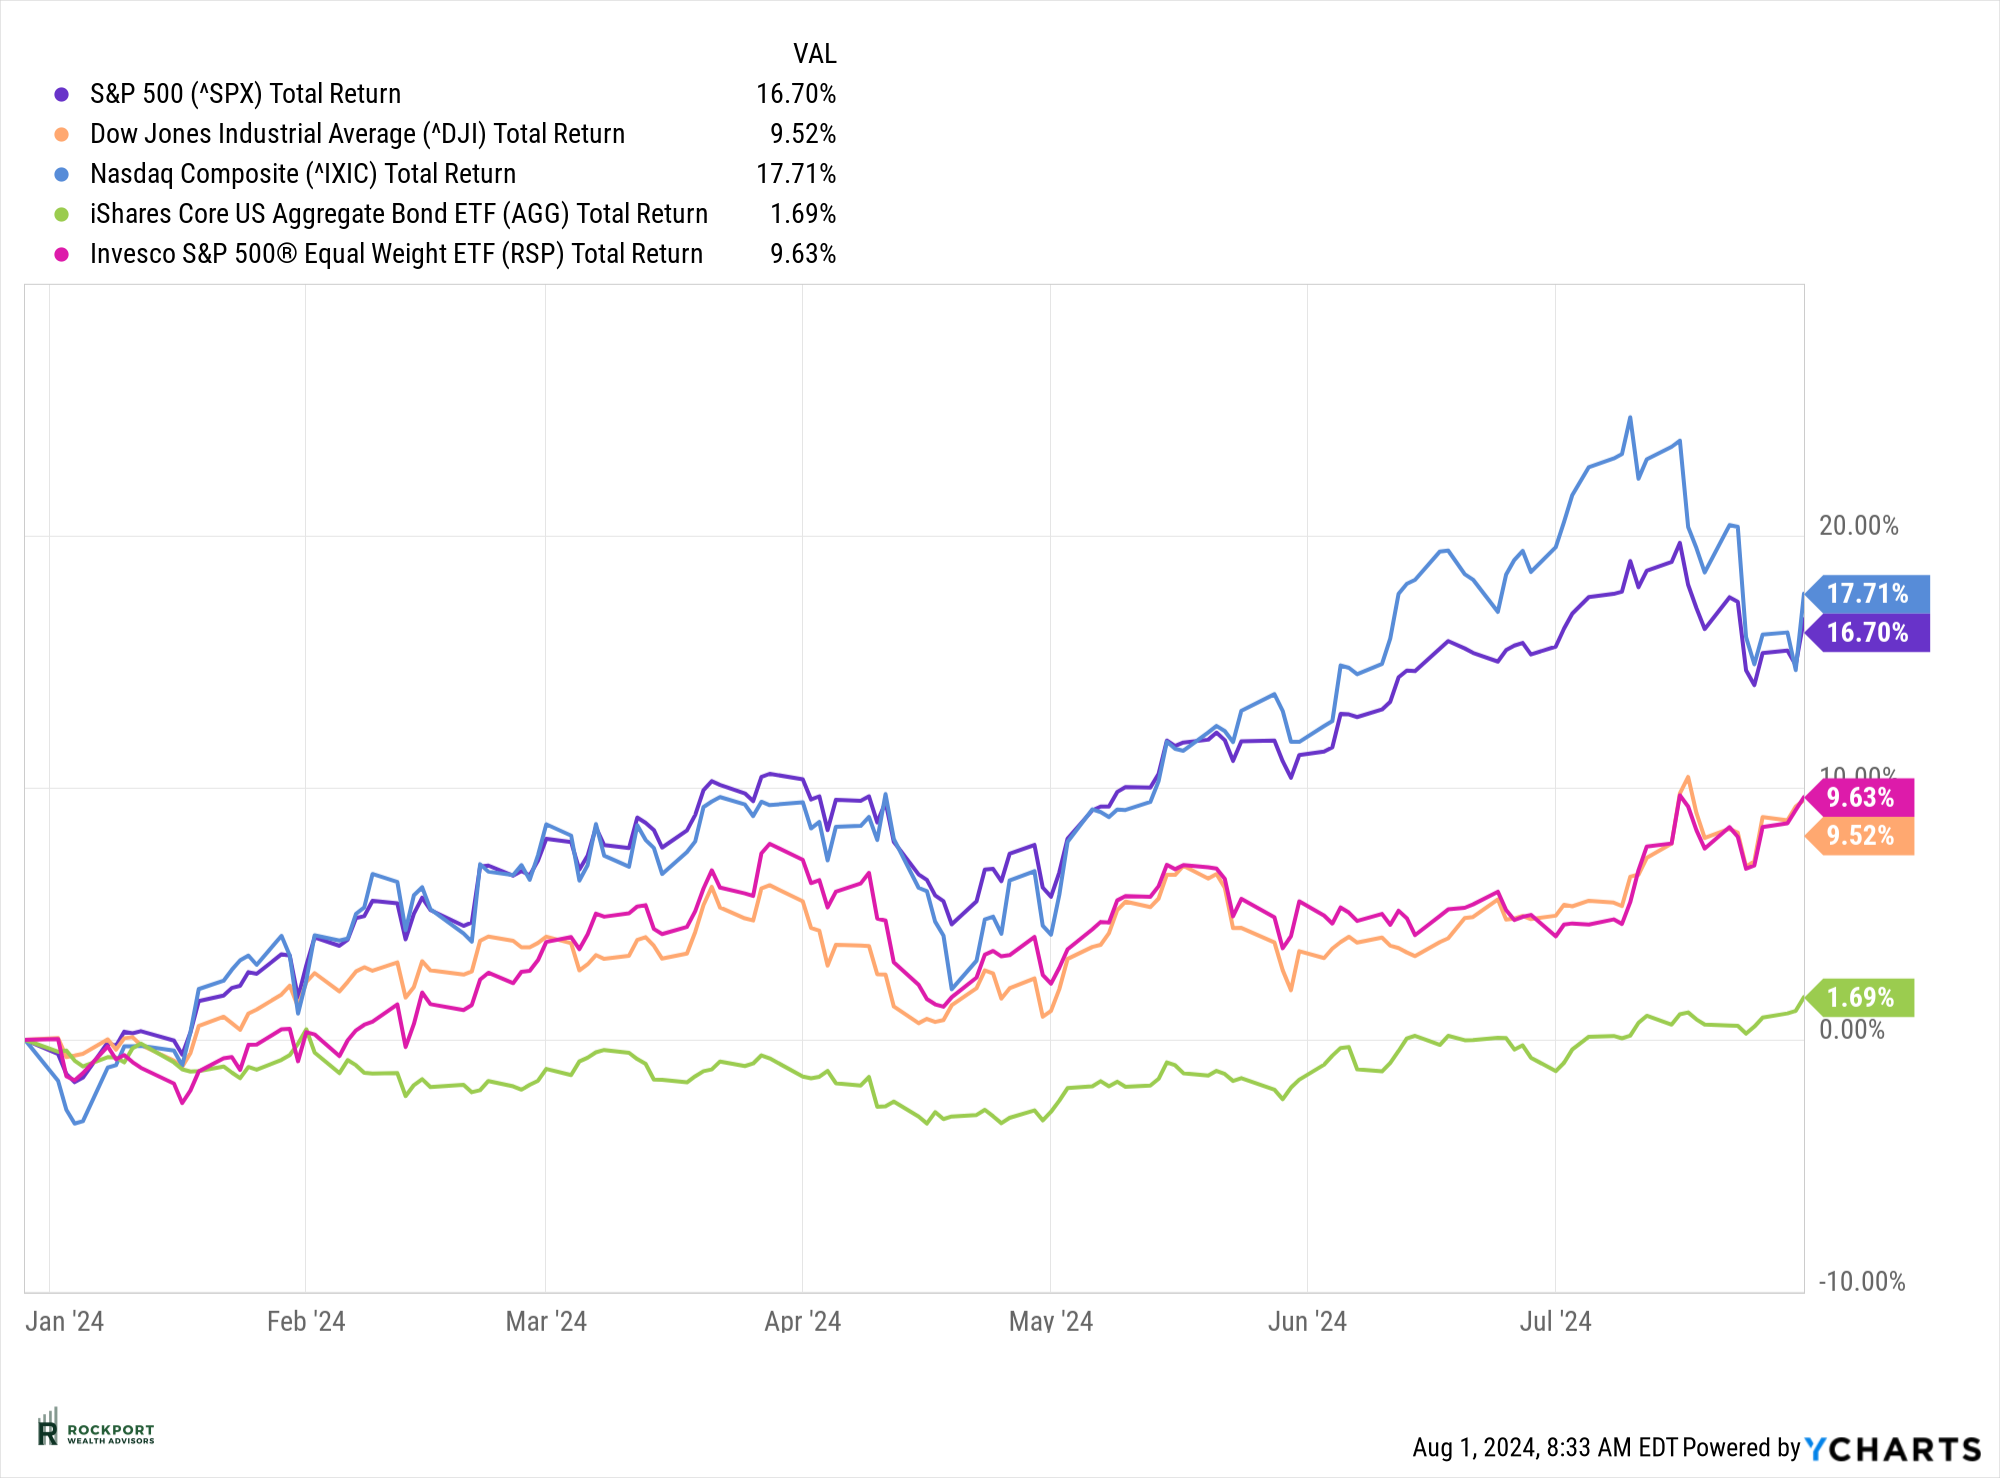
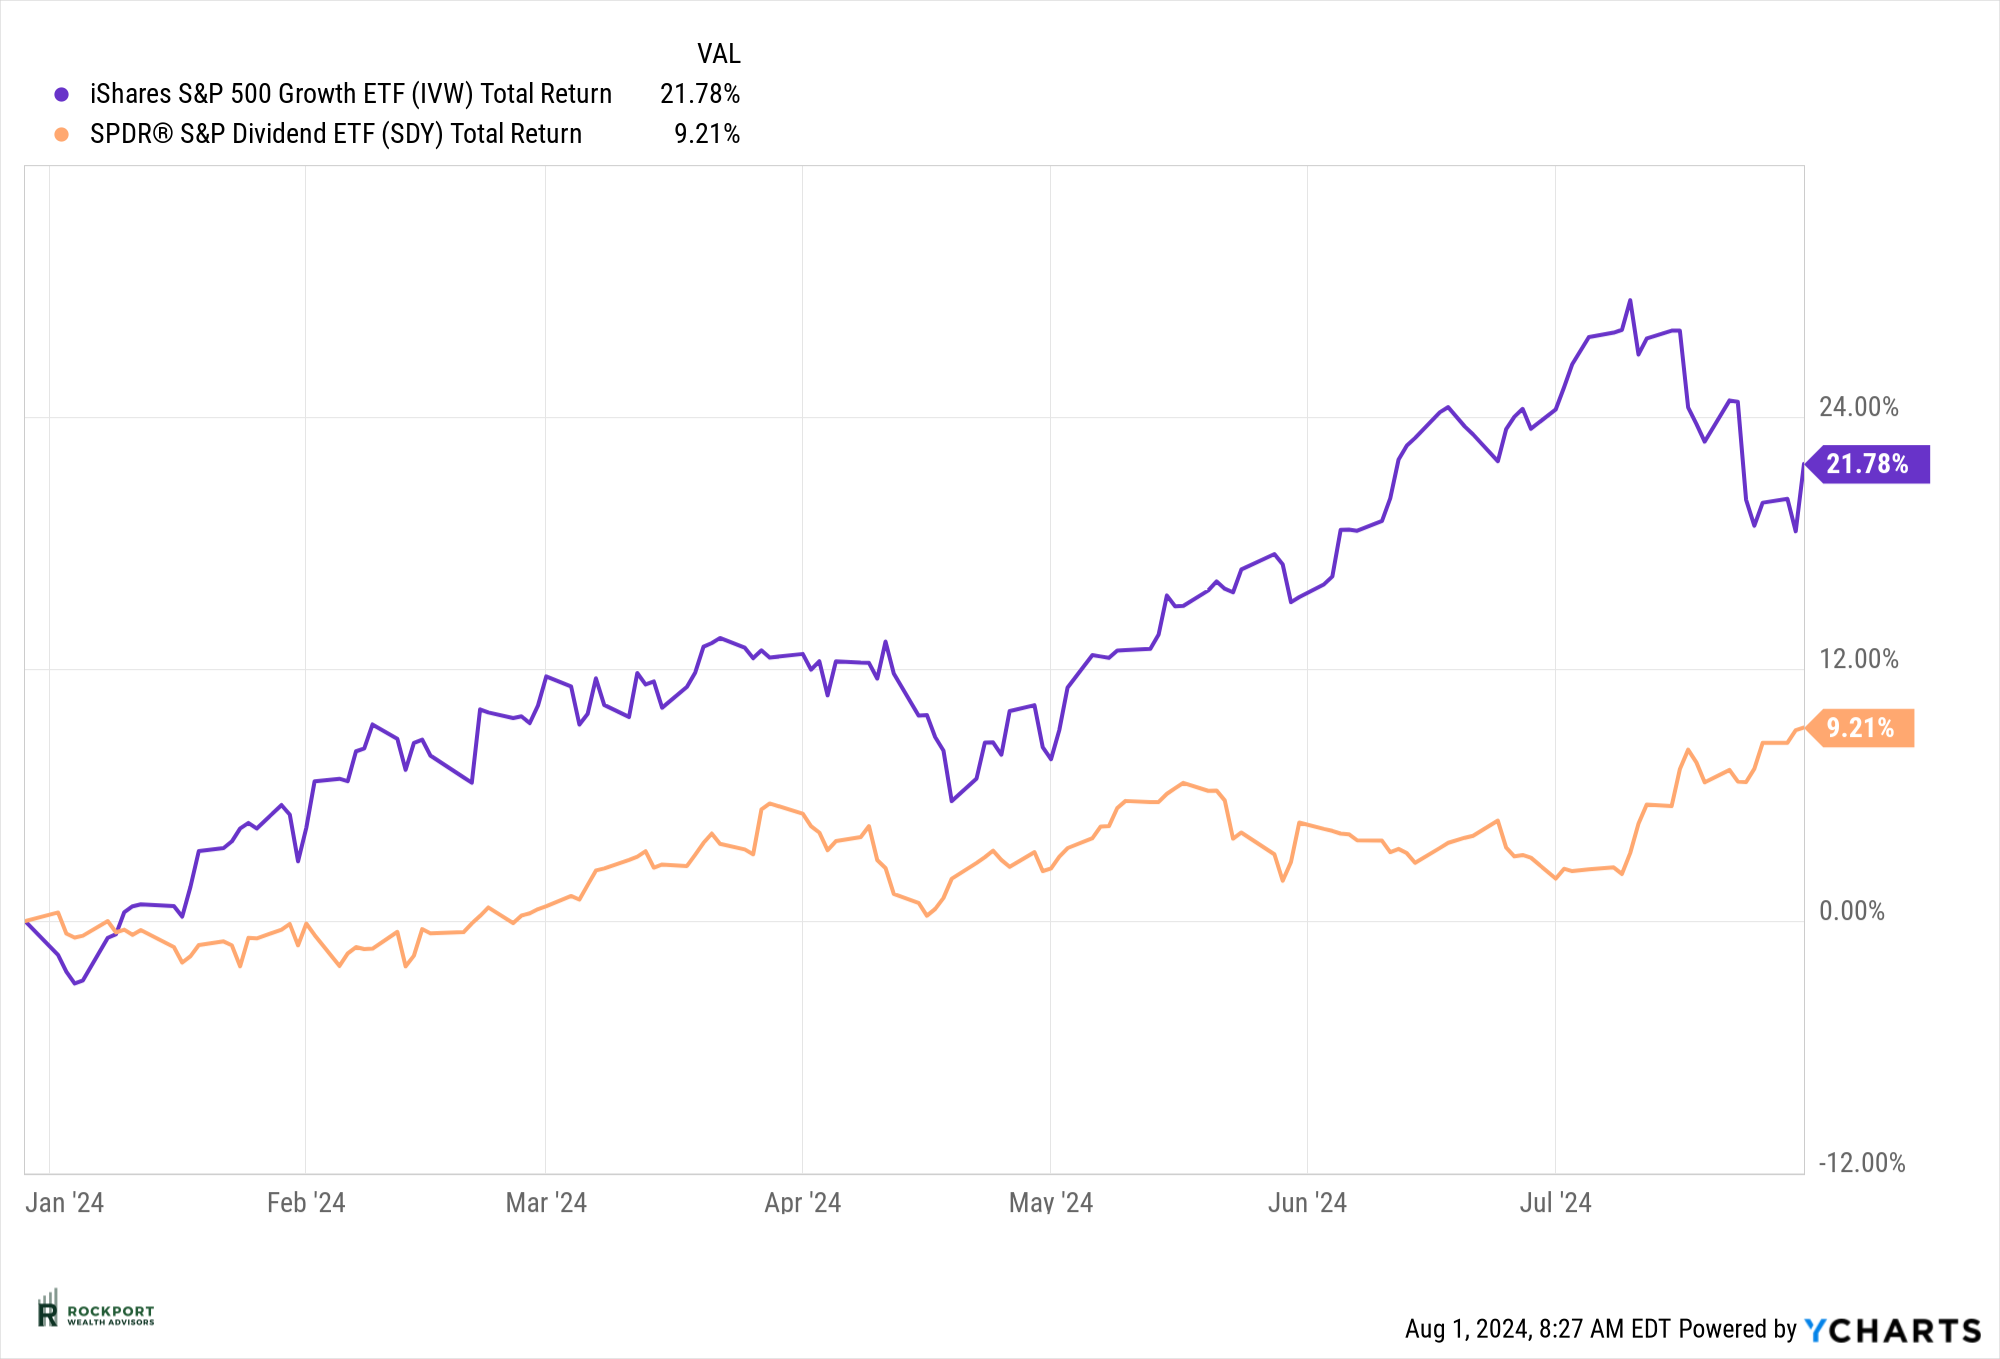
July was an interesting month for the stock market. The S&P 500 index experienced a modest increase of 1.22%, bringing its year-to-date gain to 16.7%. In contrast, the S&P 500 Equal Weight Index rose by 4.46% for the month, resulting in a year-to-date return of 9.63%. This shift indicates a broadening of market gains beyond the high-tech large-cap growth names to other sectors, a welcome trend signaling healthy broad market participation.
However, the month was not without volatility, particularly towards the end. On July 23rd, we witnessed the first day with a decline of over 2% this year, and the first such day since February 2023. This extended period without significant drops is unusual. As a result, it’s reasonable to expect more noticeable intra-day and weekly swings going forward. Despite these fluctuations, it’s crucial to remain composed and not be swayed by sensational media coverage or unqualified opinions on social media. Limiting or eliminating exposure to financial news can be beneficial during such times.
****** Special Update ******
As of Monday, August 5th, markets are experiencing a sharp decline. The S&P 500 is approximately 8% below its recent high, and the NASDAQ has dropped more than 12% from its peak. It’s too early to determine the exact cause or extent of this decline.
For months, we have noted in this newsletter that economic indicators were not aligning with the continued upward movement in stock prices, which appeared somewhat irrational. This current downturn could be a correction from that irrational buying, possibly accompanied by some irrational selling. It might also be influenced by the traditionally negative sentiment surrounding August and September. Regardless of the cause, it’s remarkable how quickly market psychology can shift from excessive optimism, as mentioned last month, to excessive pessimism. We will continue to provide updates as conditions change.
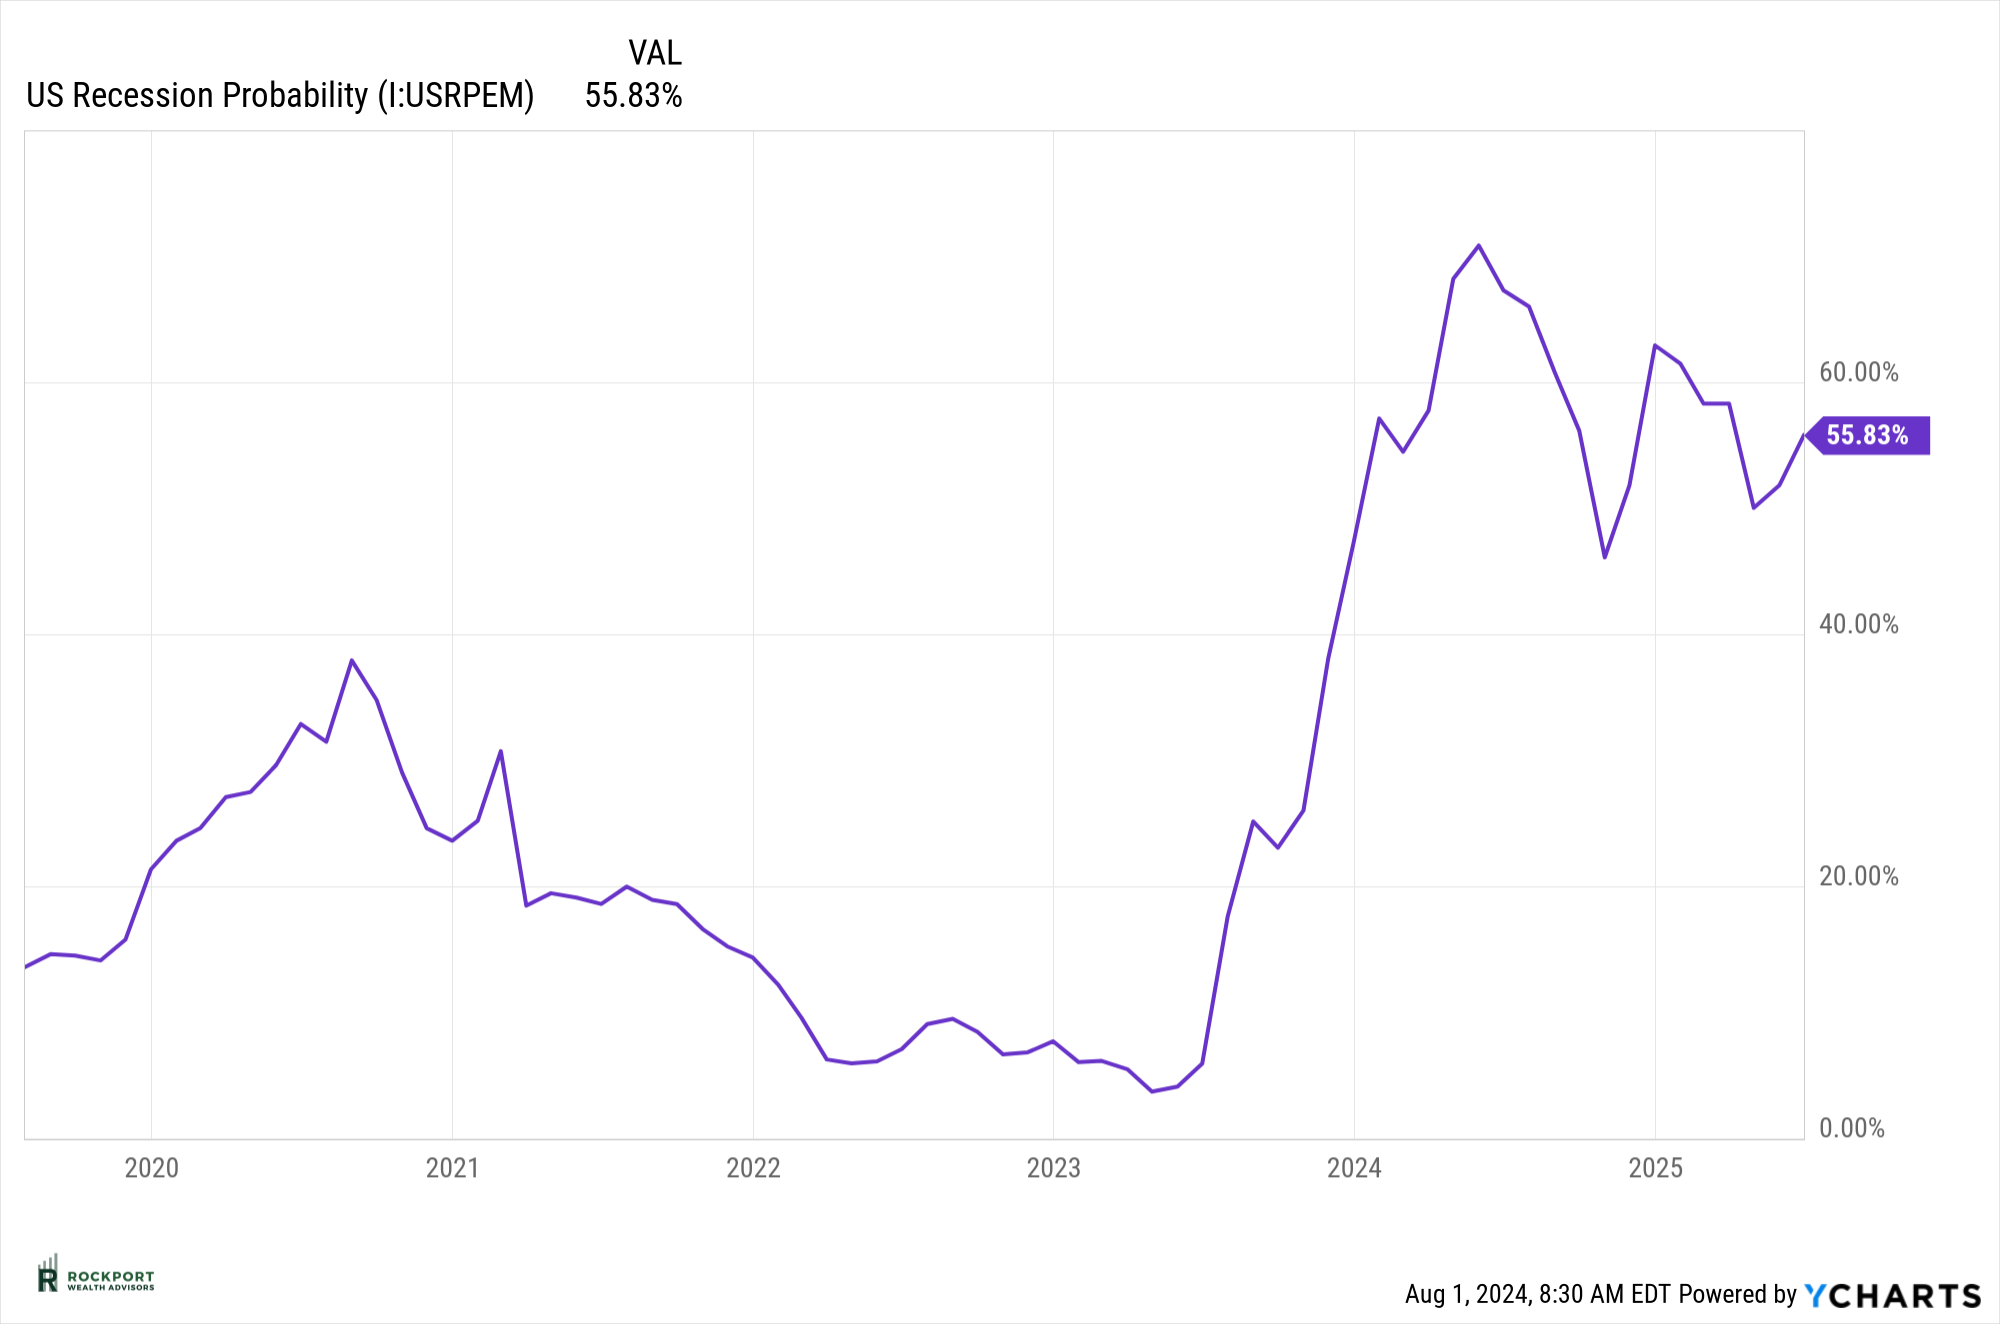
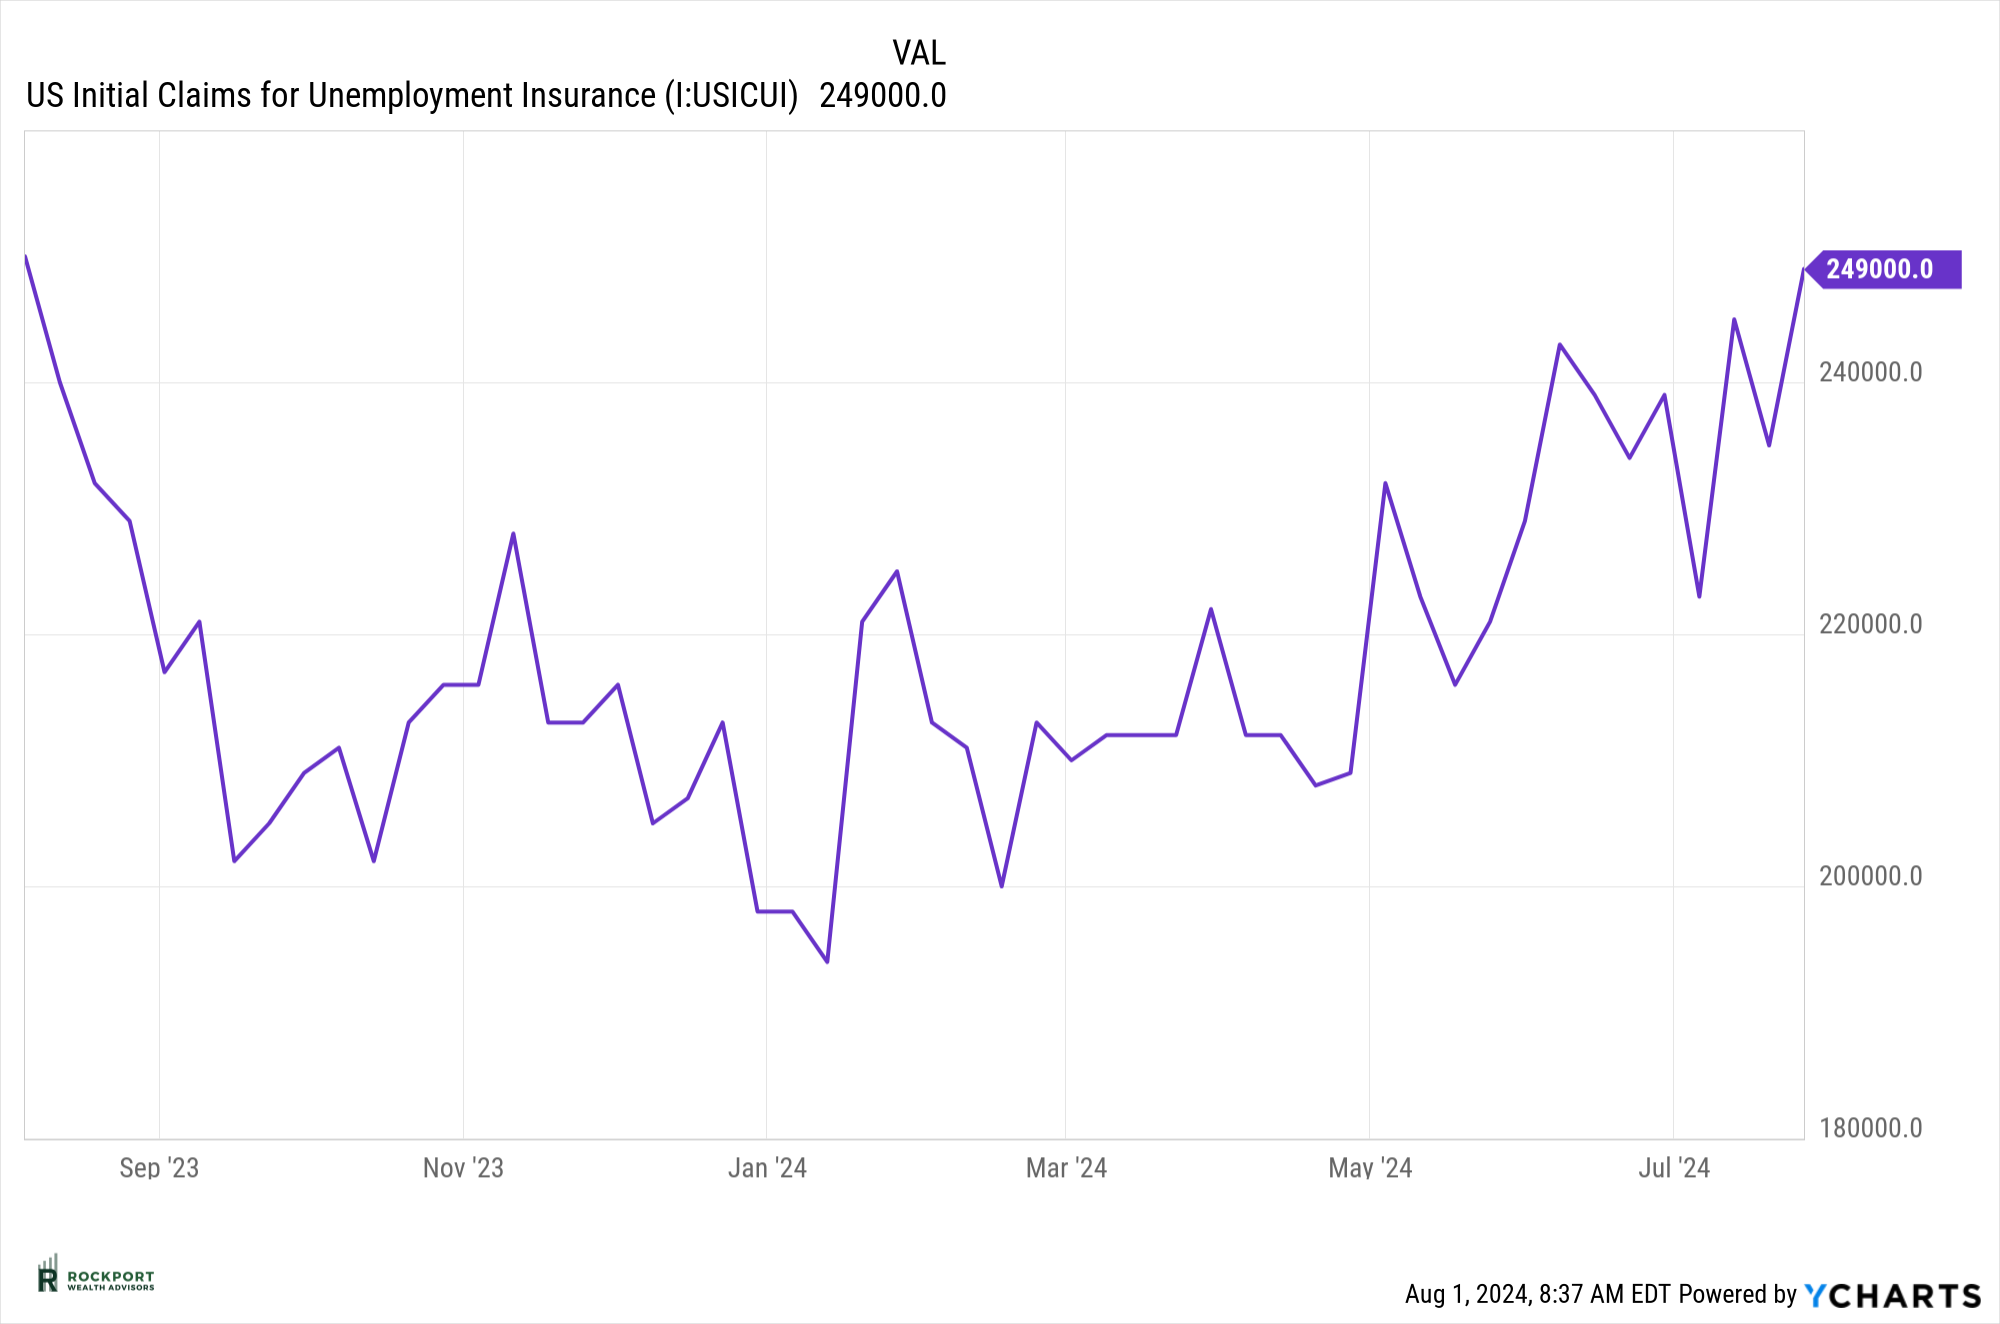
Regarding our recession watch, the likelihood of a recession has increased. At the very least, an economic slowdown is imminent. The New York Fed’s recession probability index has risen to 55.83%. Consumer confidence has slightly decreased, and although the employment situation is not dire, it has weakened again. Both continuing and initial unemployment claims are on the rise.
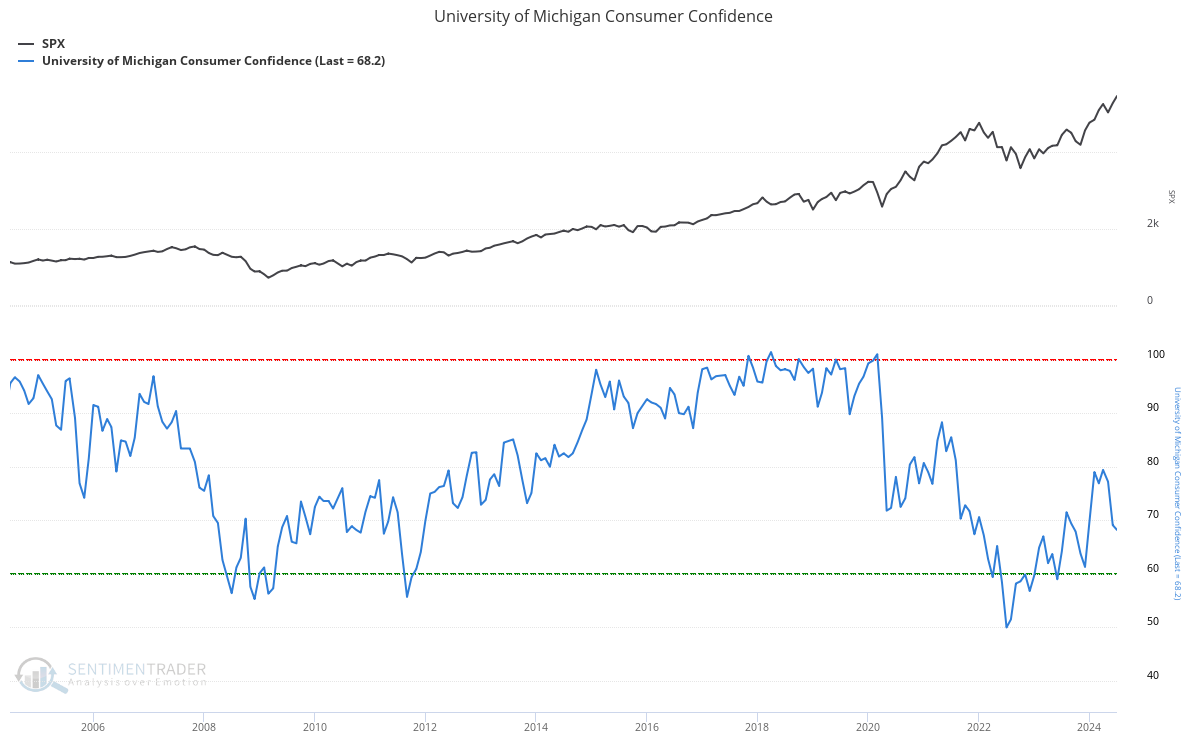
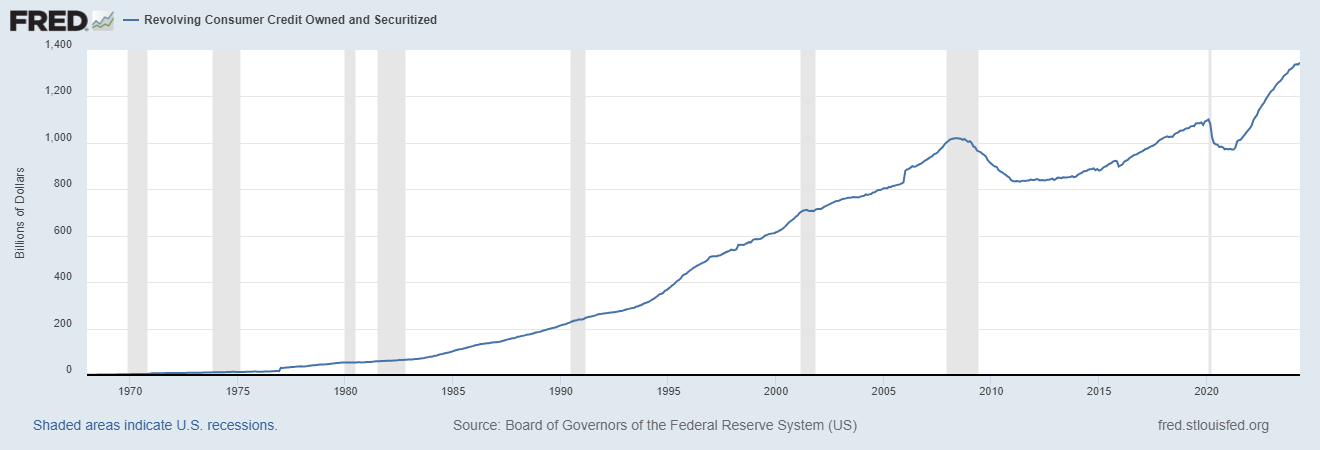
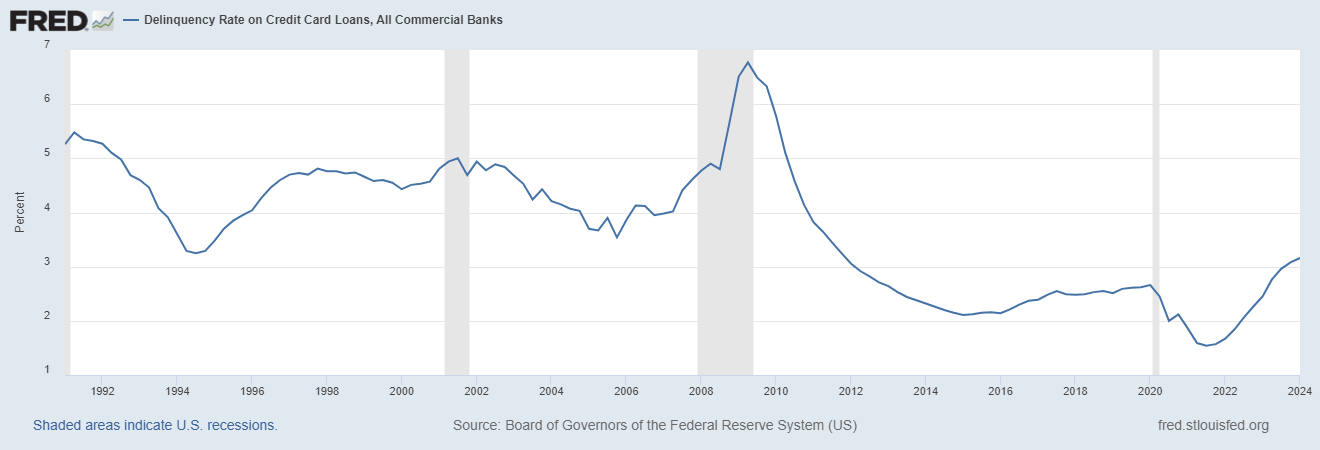
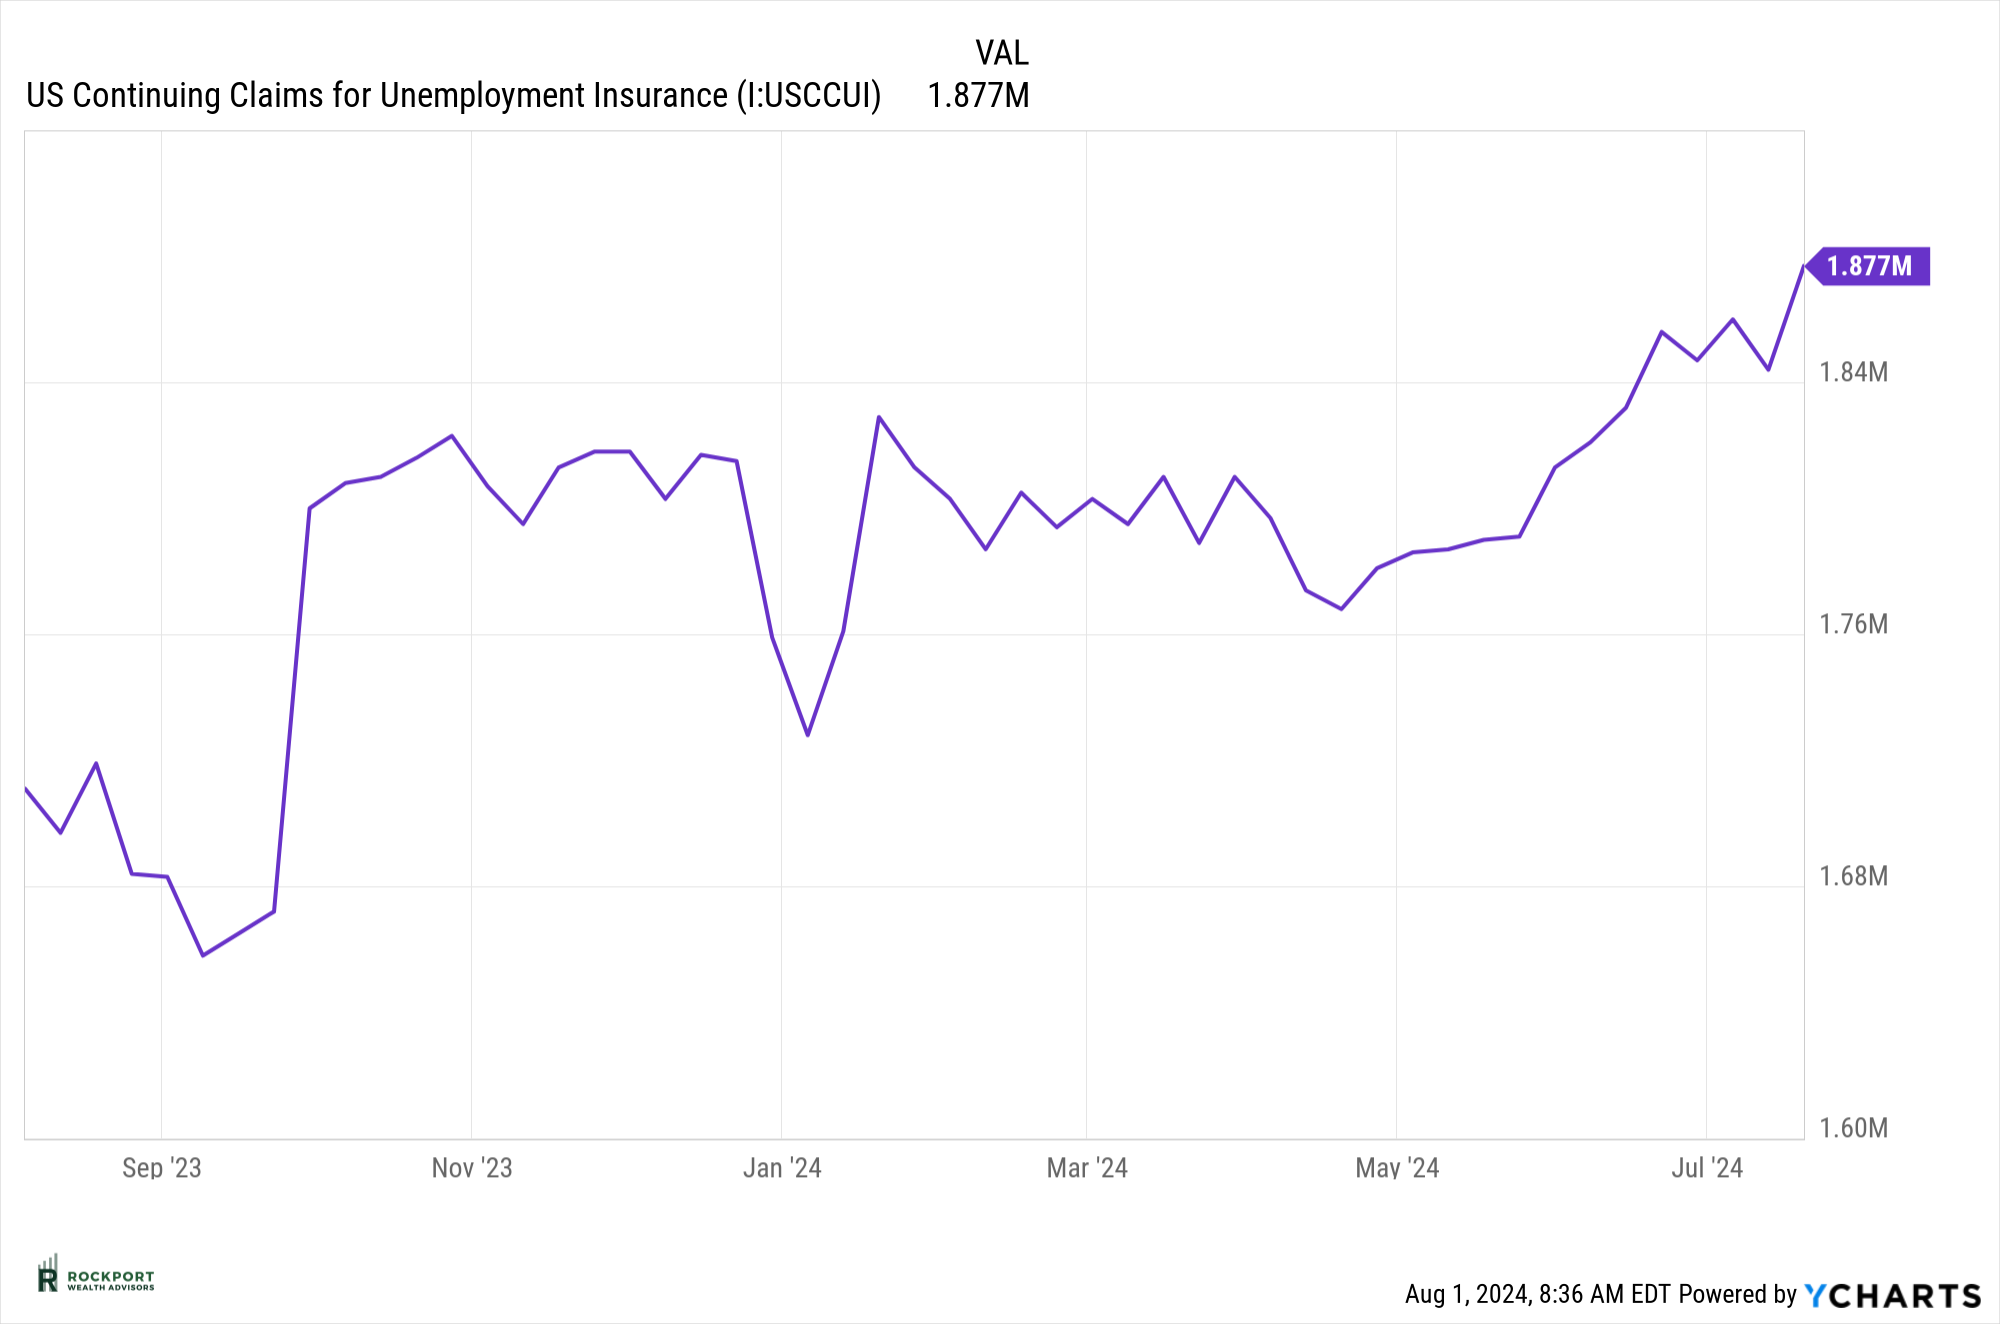
As we’ve highlighted many times, consumer strength is crucial in avoiding recessions. Currently, consumers are showing signs of slowing down and, in some cases, stress. Credit card balances remain at all-time highs, and default rates on these cards and other loans are at their highest level since late 2011. This will be a key area to monitor in the coming months.
There is some good news on the inflation front: the Consumer Price Index (CPI) has dropped below 3% for the first time since 2021. This is a positive development, and we hope that consumer prices will continue to moderate in the coming months, especially as commodity prices have also declined.
After more than two years of frequently discussing inflation, we will make this our final mention for now. We will continue to monitor this data internally, and if inflation shows signs of rising again, we will revisit the topic with updated charts. For now, we are putting this issue to rest, hopefully for an extended period.
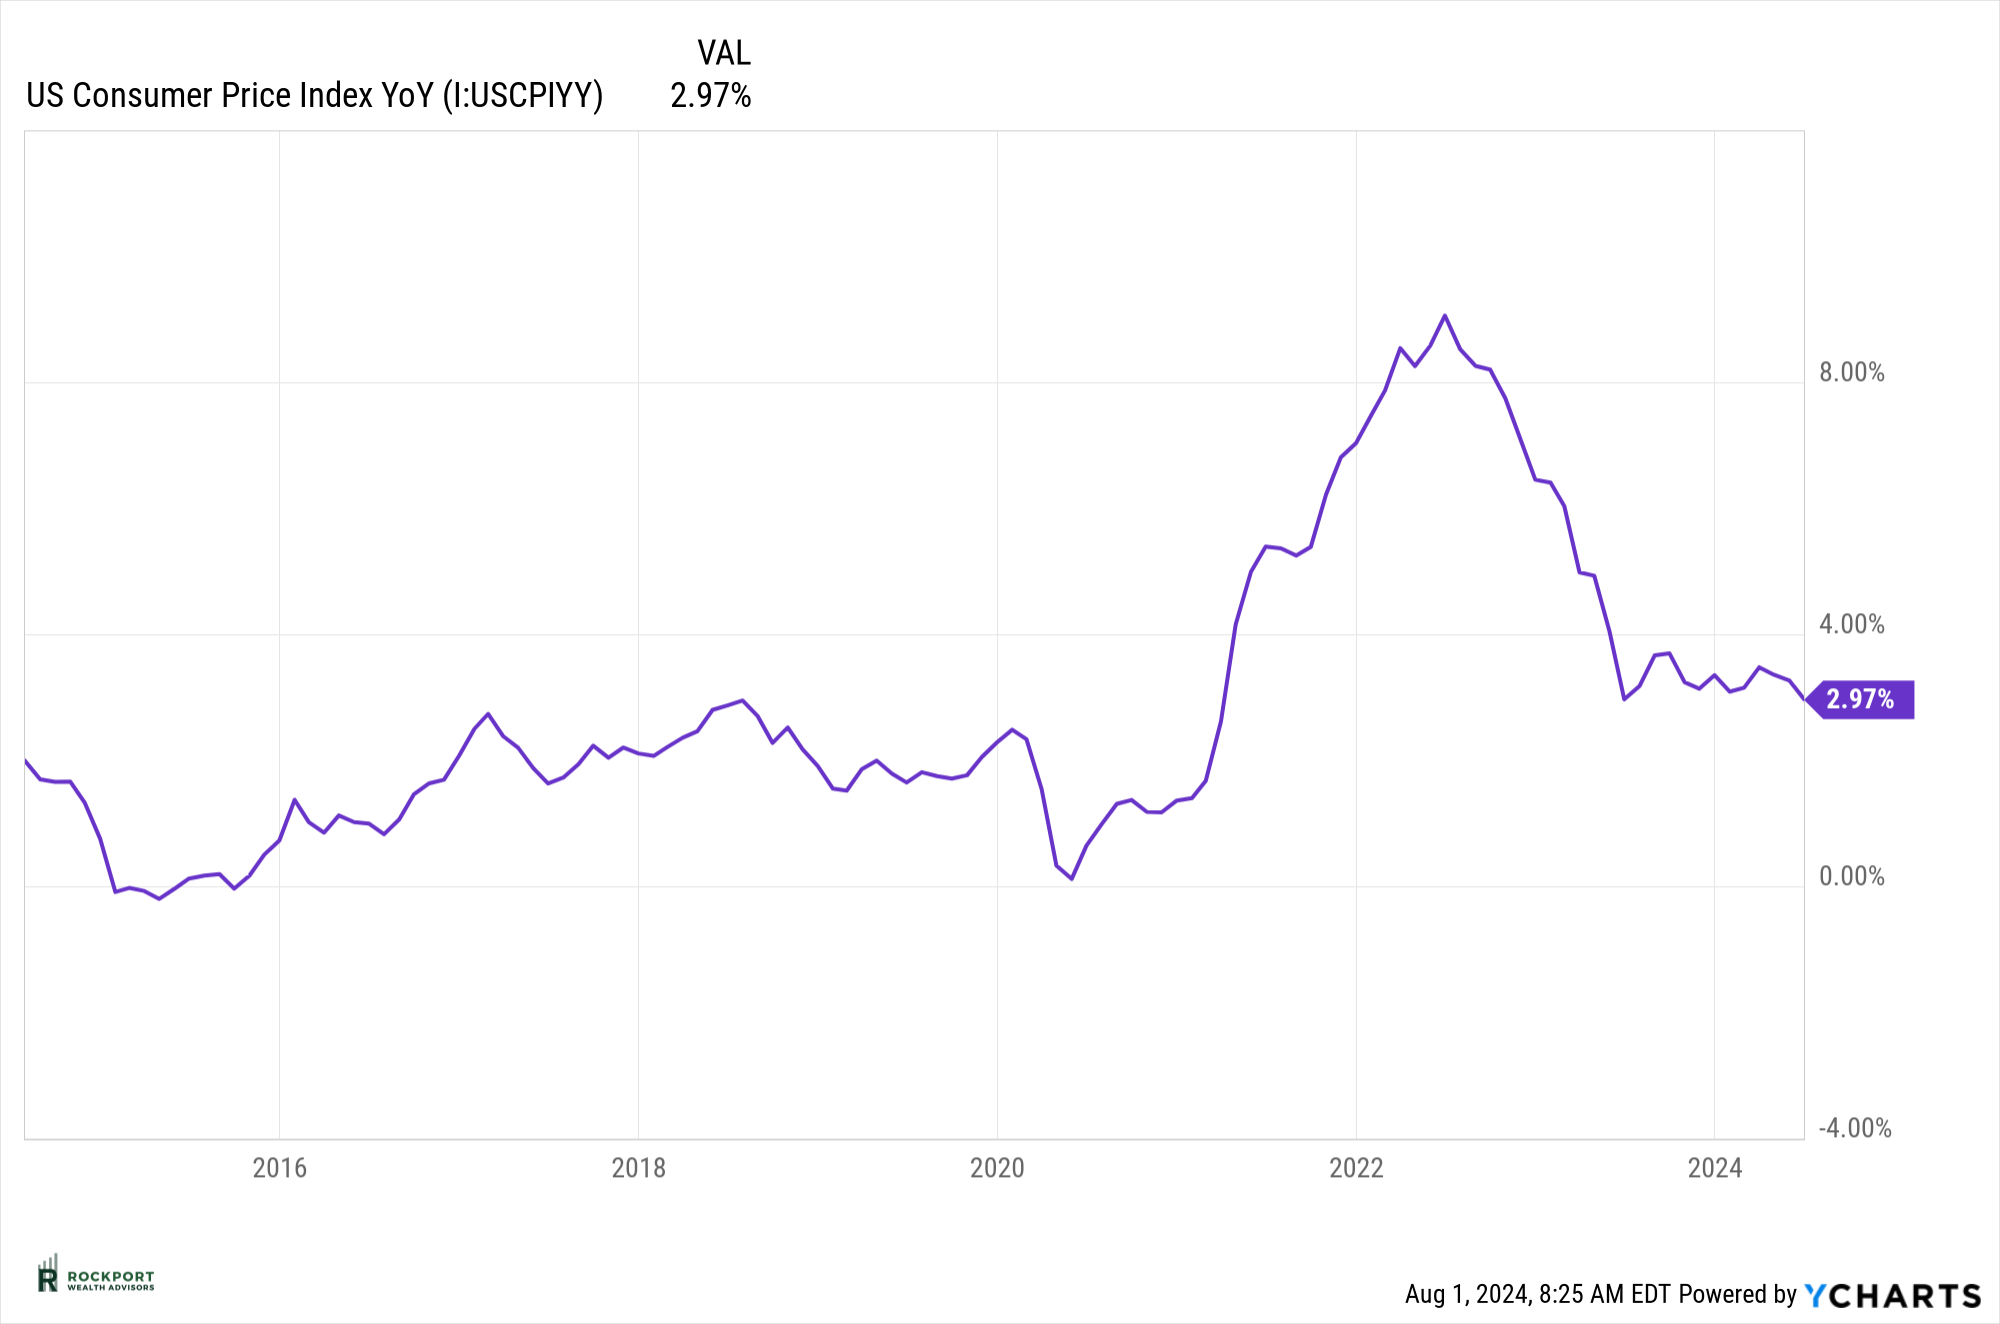
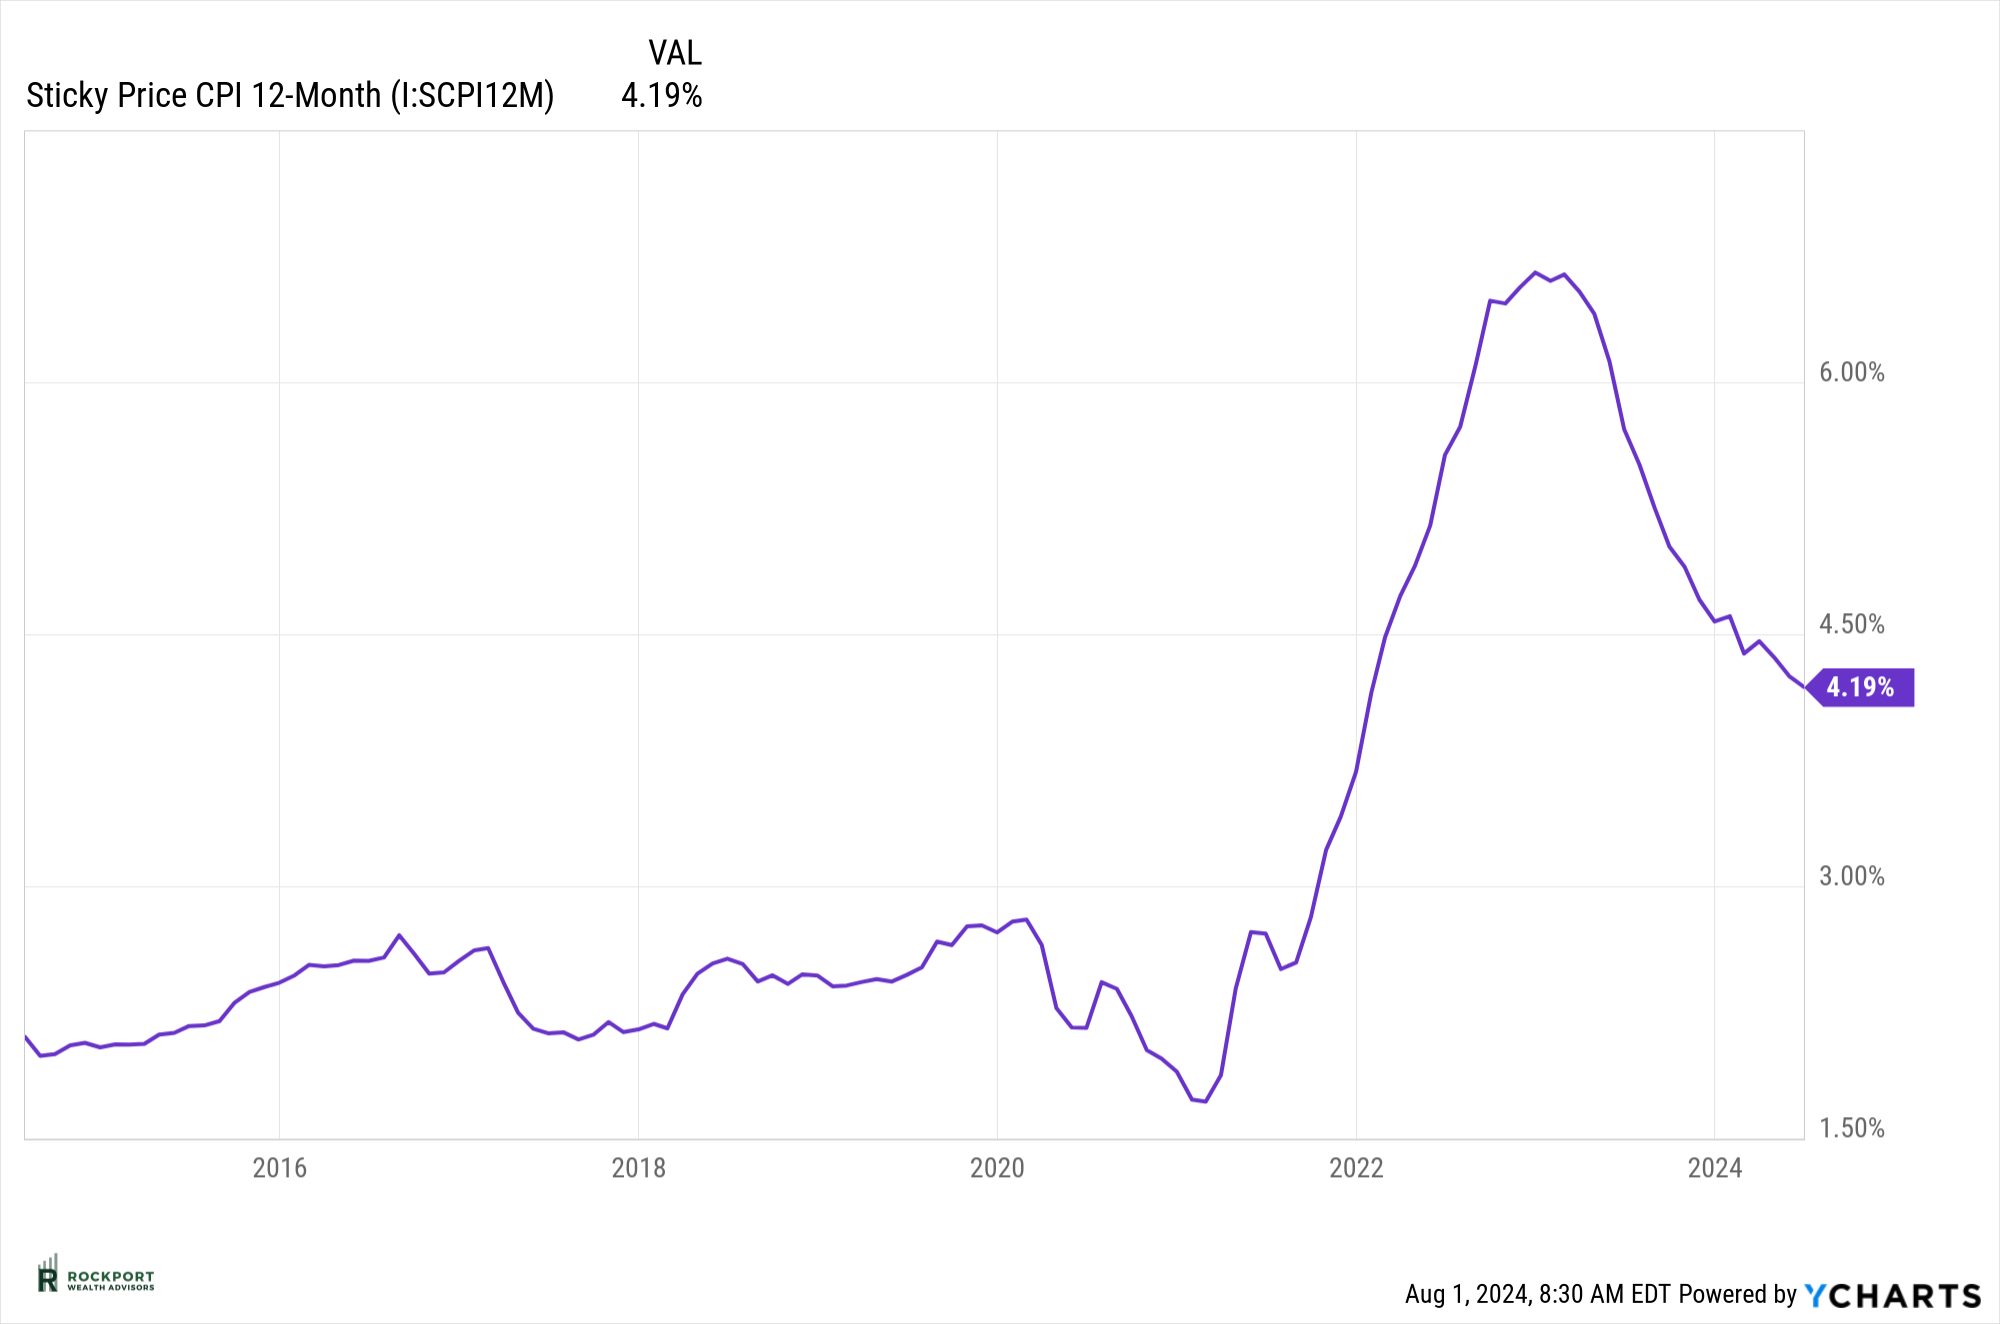
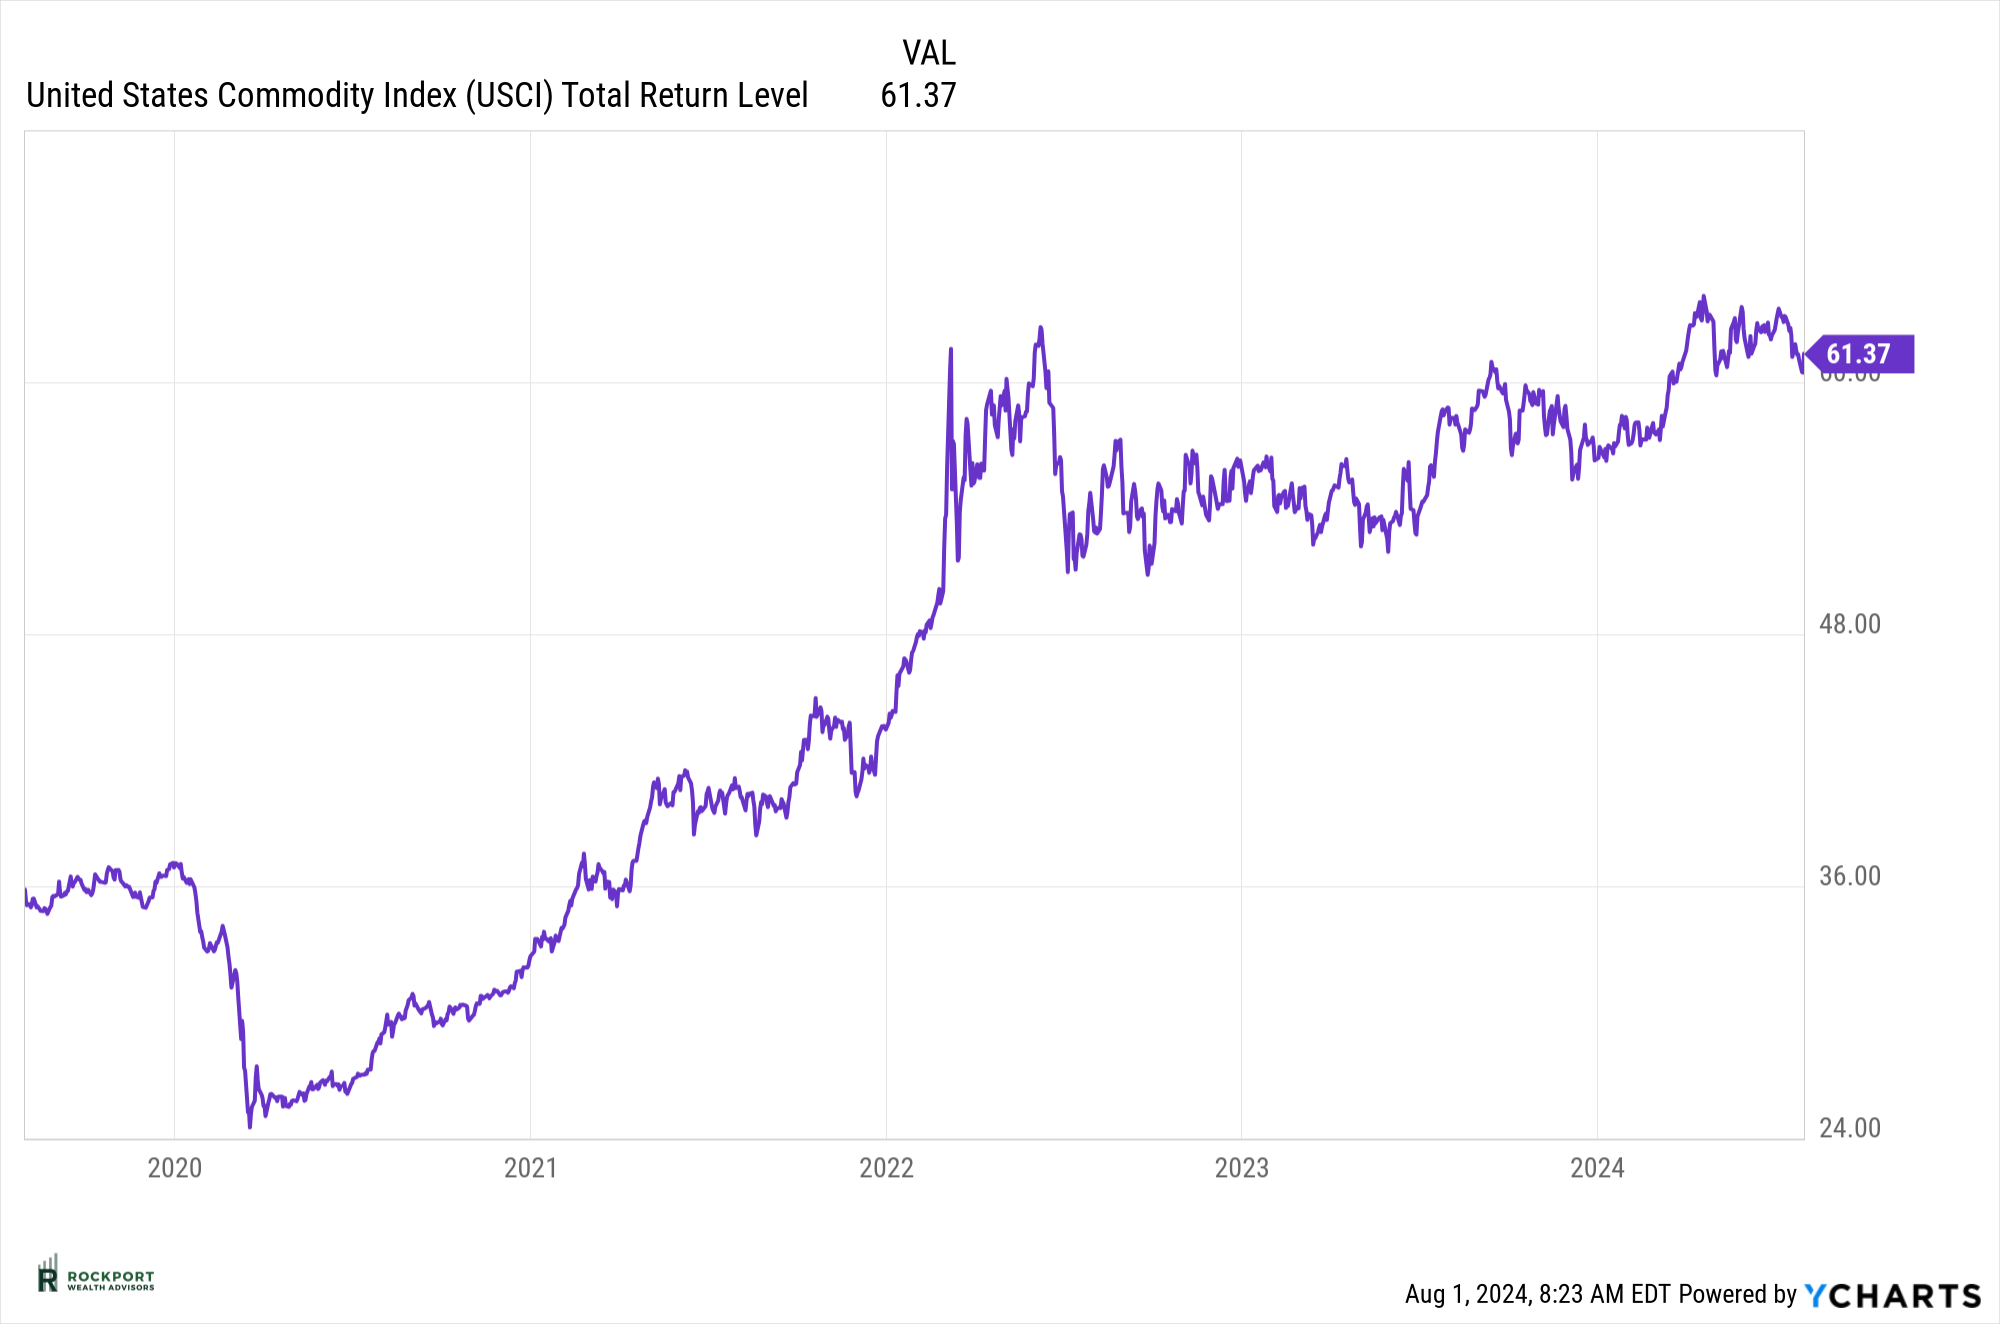
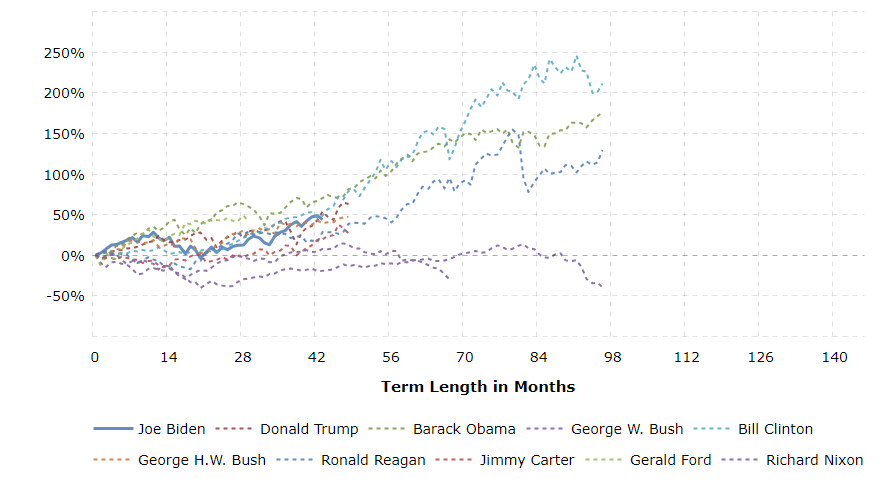
Lastly, with this being an election year there are a lot of questions. One common phrase is that if XYZ person gets elected the markets are going to tank. As you can see in the chart below, the stock market has had success under both parties and a long line of presidents. The only two presidents in modern times that had the stock market fall during their terms were Richard Nixon and George W Bush. So, let’s not assume a given outcome in the election will dictate future investment or that this time is different.
Tax Talk
For years the Required Minimum Distribution (RMD) Age was 70.5. Many don’t realize that the required minimum distribution age has changed. So, which RMD age to use? That depends on your year of birth. See below:
Born 1950 or earlier – Age 72 (or 70 ½)
Born 1951 – 1959 – Age 73
Born 1960 or later – Age 75
Ultimately the responsibility for RMD’s falls on the taxpayer, but we are here to help in terms of starting dates and calculations. If you have any questions on your specific situation, please feel free to reach out.
Rockport News
Salute To Service Golf 2024
Lastly, our annual Salute to Service Golf outing benefiting our veterans is August 12th at Red Tail Golf Club in Avon, Ohio. With this years event we are proud to be supporting two wonderful veteran organizations, GallantFew and the National Veterans Memorial and Museum. Thank you to those who have graciously contributed already. If you would like to donate or sign up a group to golf please visit www.salutetoservicegolf.com.
As always, if you have any questions on anything we have talked about here or anything else that is on your mind, please feel free to reach out.
*The Standard & Poor’s 500 (S&P 500) is an unmanaged group of securities considered to be representative of the stock market in general. Results can be found at slickcharts.com.
*Treasury yields can be found at finance.yahoo.com.
*Charts produced at yCharts.com
*Bonds can be found at bloomberg.com/markets/rates-bonds
*Fed Rate Probability Chart can be found at cmegroup.com/markets/interest-rates/cme-fedwatch-too
*The LEI can be found at conference-board.org/topics/us-leading-indicators
*Treasury Yield Curve can be found at Gurufocus.com
*University of Michigan Consumer Confidence produced at SentimenTrader
*Rockport Models – Please remember we are referencing our model portfolios, and your portfolio may differ from the models mentioned depending on your individual needs and circumstance.

