
We hope this month’s newsletter finds you in great spirits after what was hopefully a fun and relaxing 4th of July!
Markets & Economy
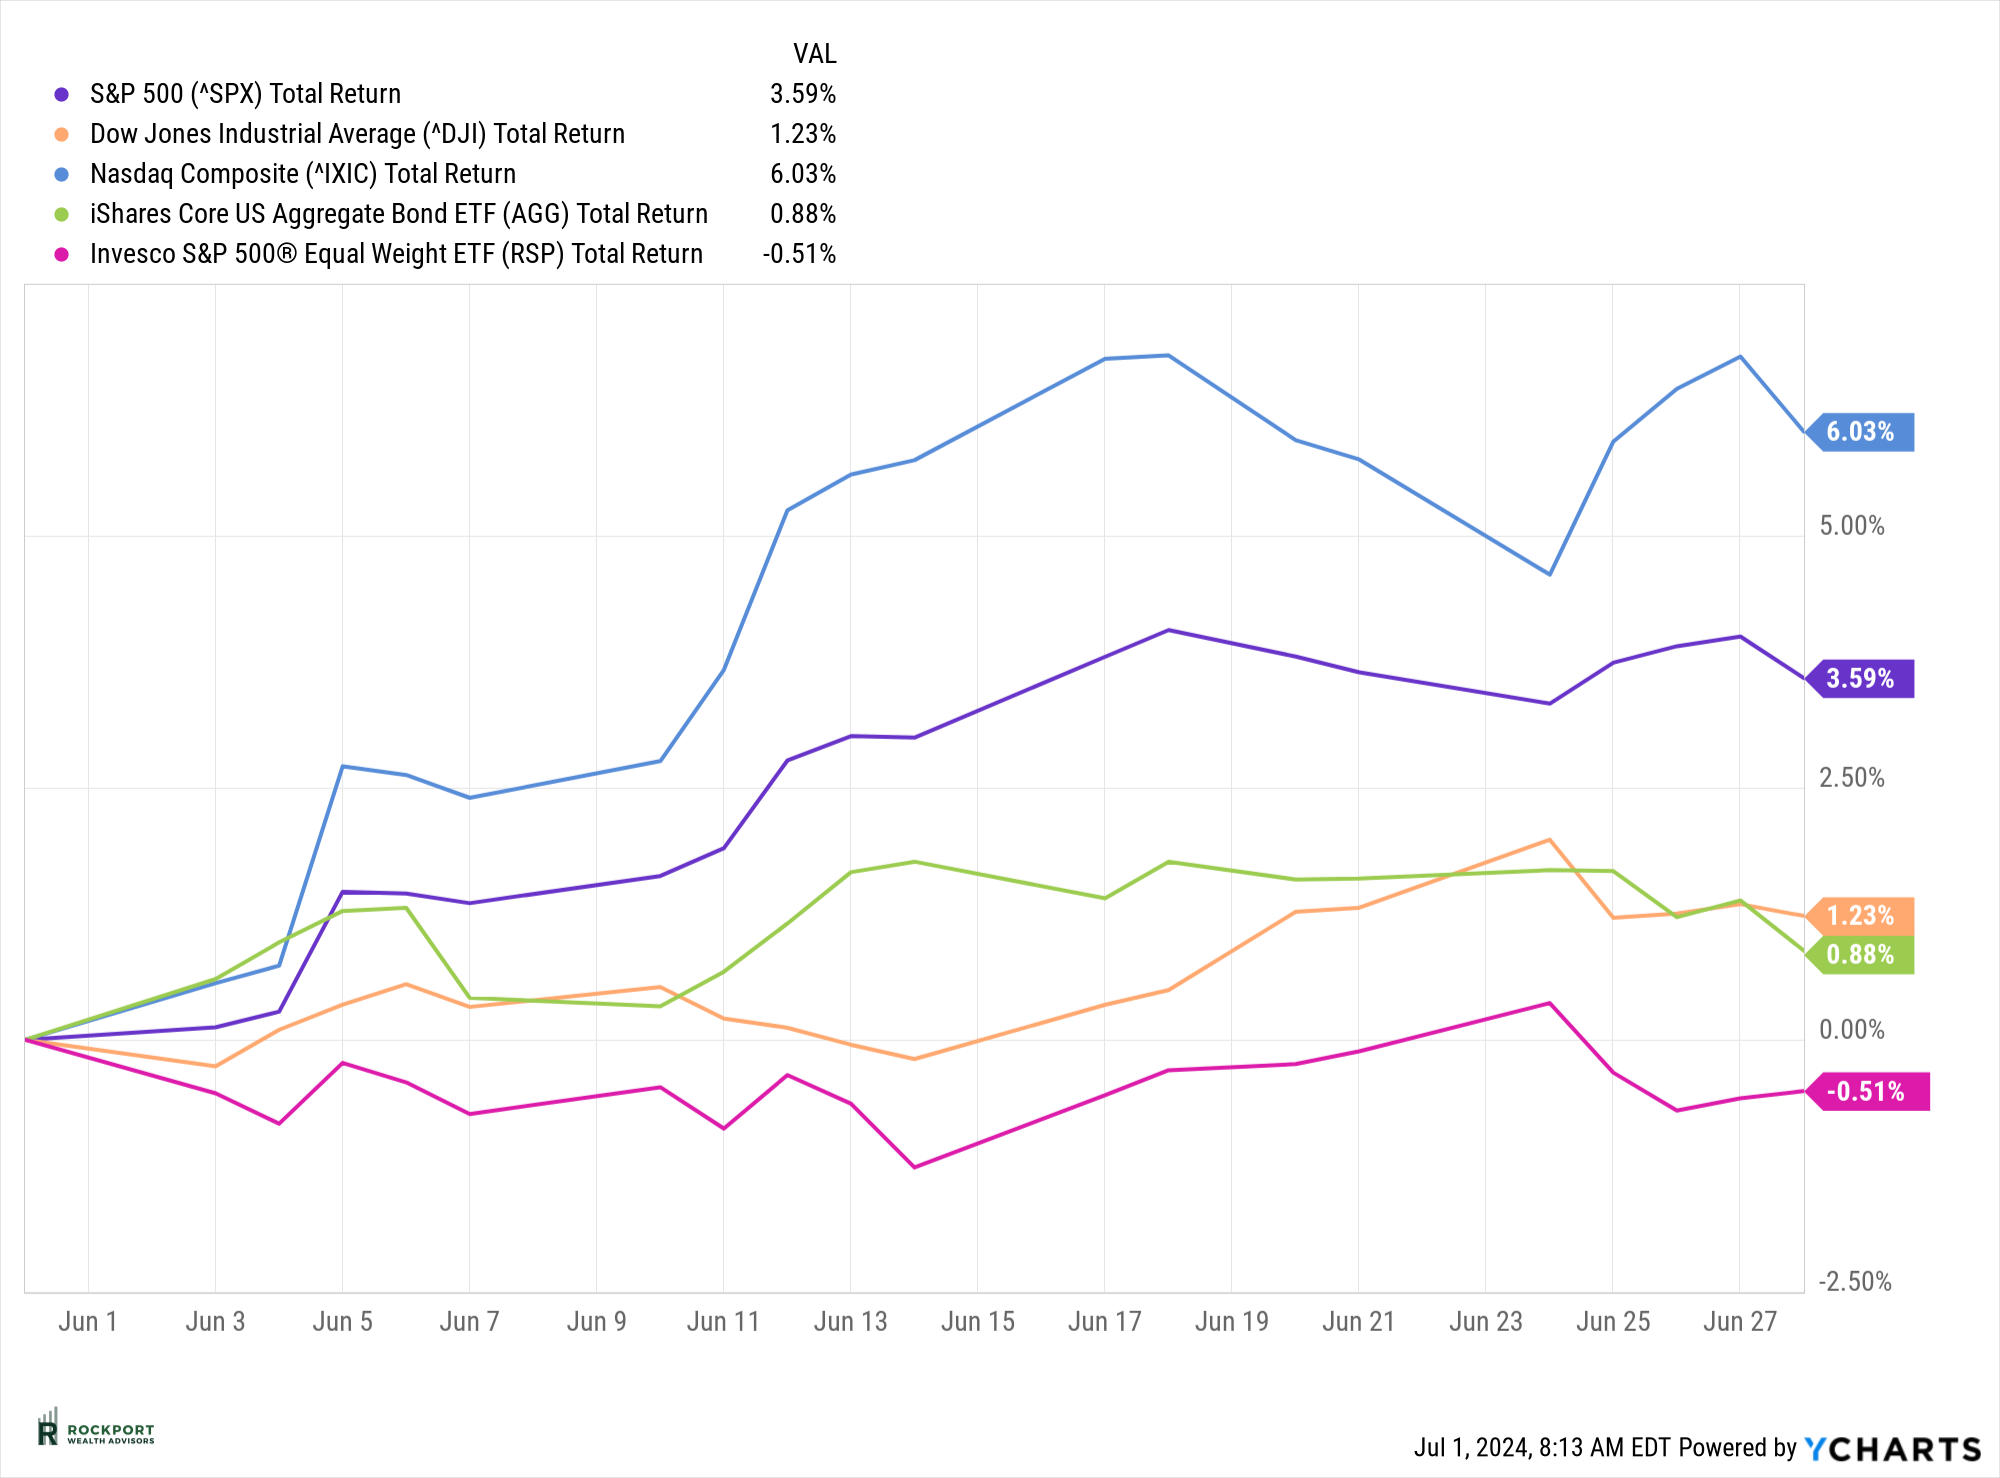
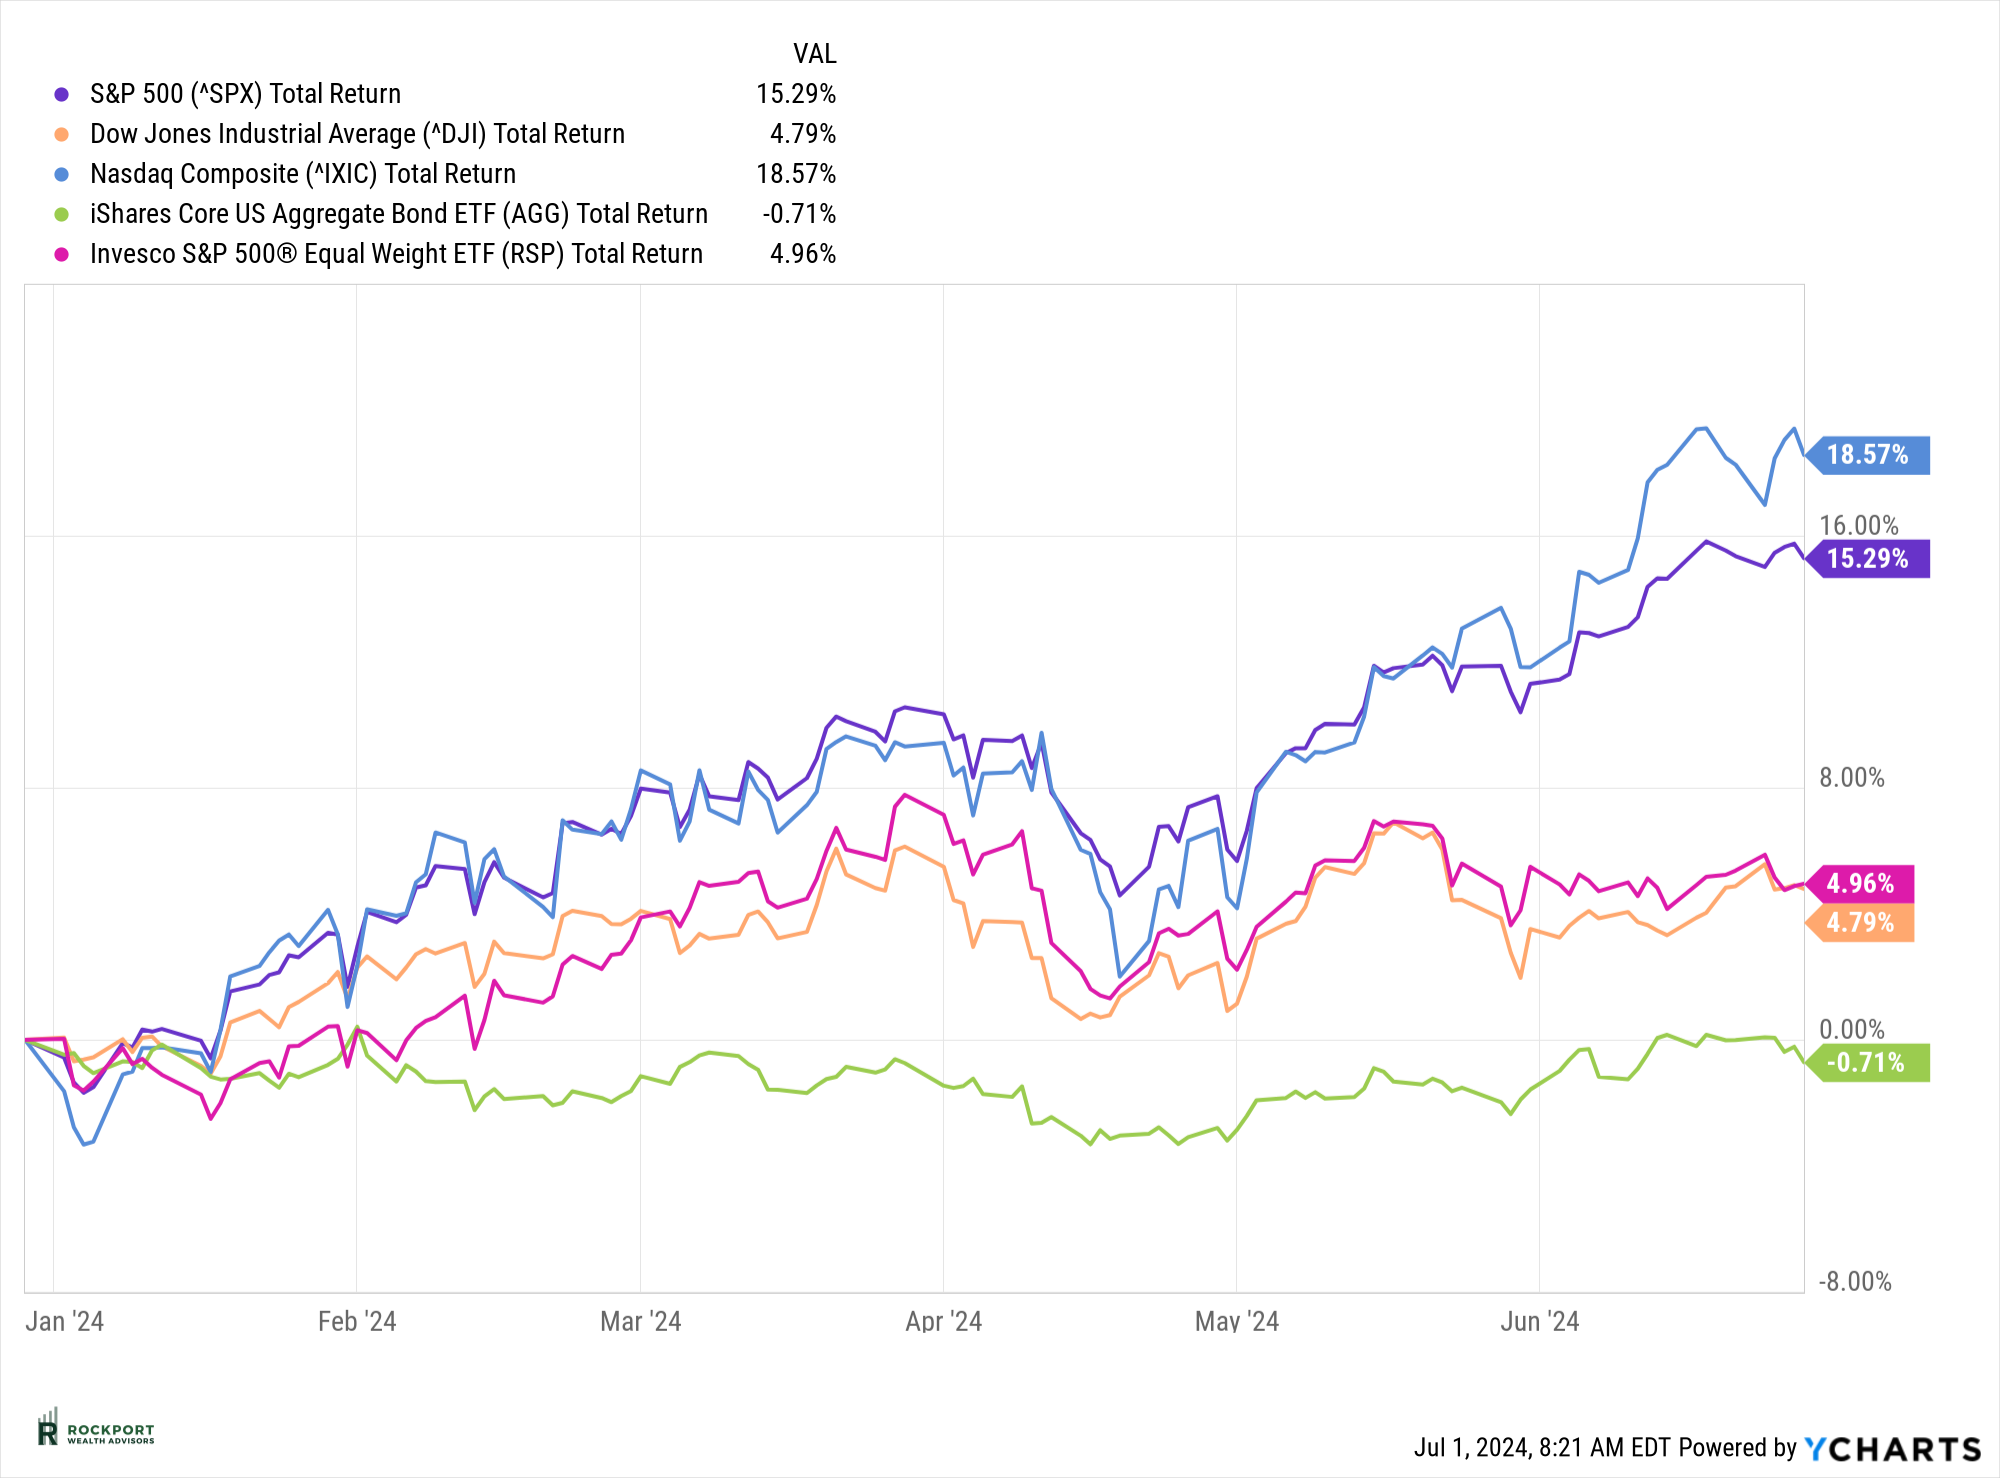
The markets continued their steady climb in June, with the S&P 500 gaining 3.59% for the month. This brings its total return for the first half of the year to an impressive 15.29%. It’s remarkable to see the consistency in market performance, driven predominantly by a select few stocks. In fact, just 10 stocks have contributed to over 75% of the index’s gains this year.
Once again, the S&P Equal Weight Index underperformed the market cap-weighted index, declining by 0.51% in June. However, it has managed a year-to-date increase of 4.96%. The current market dynamic, heavily influenced by a small number of stocks, raises questions about future corrections. Will only these top performers adjust, or will they impact the broader market? Time will tell.
Historically, July has been a positive month for the markets. ¹ However, as we move past July, we often see a shift in seasonality, with August, September, and October typically underperforming. Last year, this same period saw an 11% decline.
Given that this is an election year, we anticipate additional volatility due to the uncertainty surrounding the elections. Markets generally dislike uncertainty, preferring to have a clear understanding of the conditions they are facing. Currently, market psychology is excessively positive. Historically, such behavior is often seen closer to market tops than bottoms. We’re noticing an increase in irrational comments and actions, like investors insisting on putting all their money into a single stock they believe will never decline, or first-time investors moving their safe money into the market based on a hot tip.
Our experience tells us that very few individuals can tolerate significant declines in their investments. Many investors feel confident taking risks during a market upswing, but when the inevitable downturn occurs, panic often sets in, leading them to change strategies or sell at a loss.
At our firm, we focus on achieving returns that align with your financial plan and risk tolerance. While we may not match the gains of a runaway market, we also avoid the steep declines of 20%, 30%, or 40%, which can take a long time to recover from. Our goal is to provide a balanced approach that helps ensure stability and long-term growth.
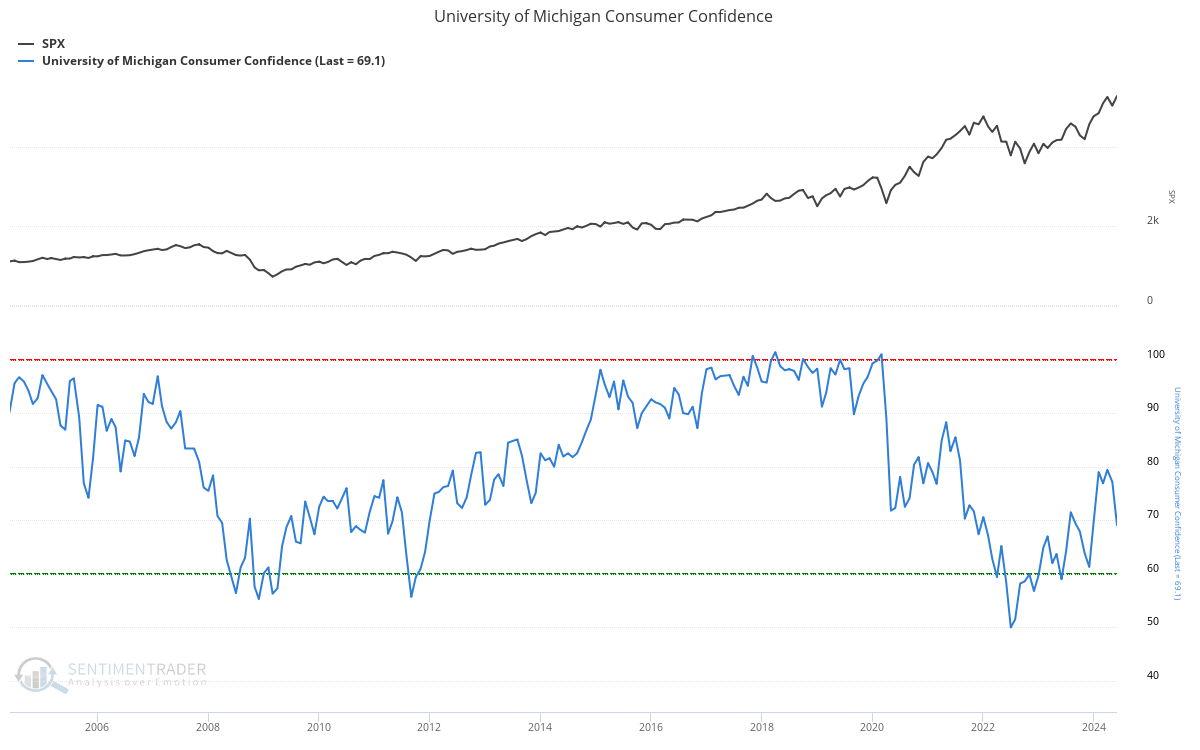
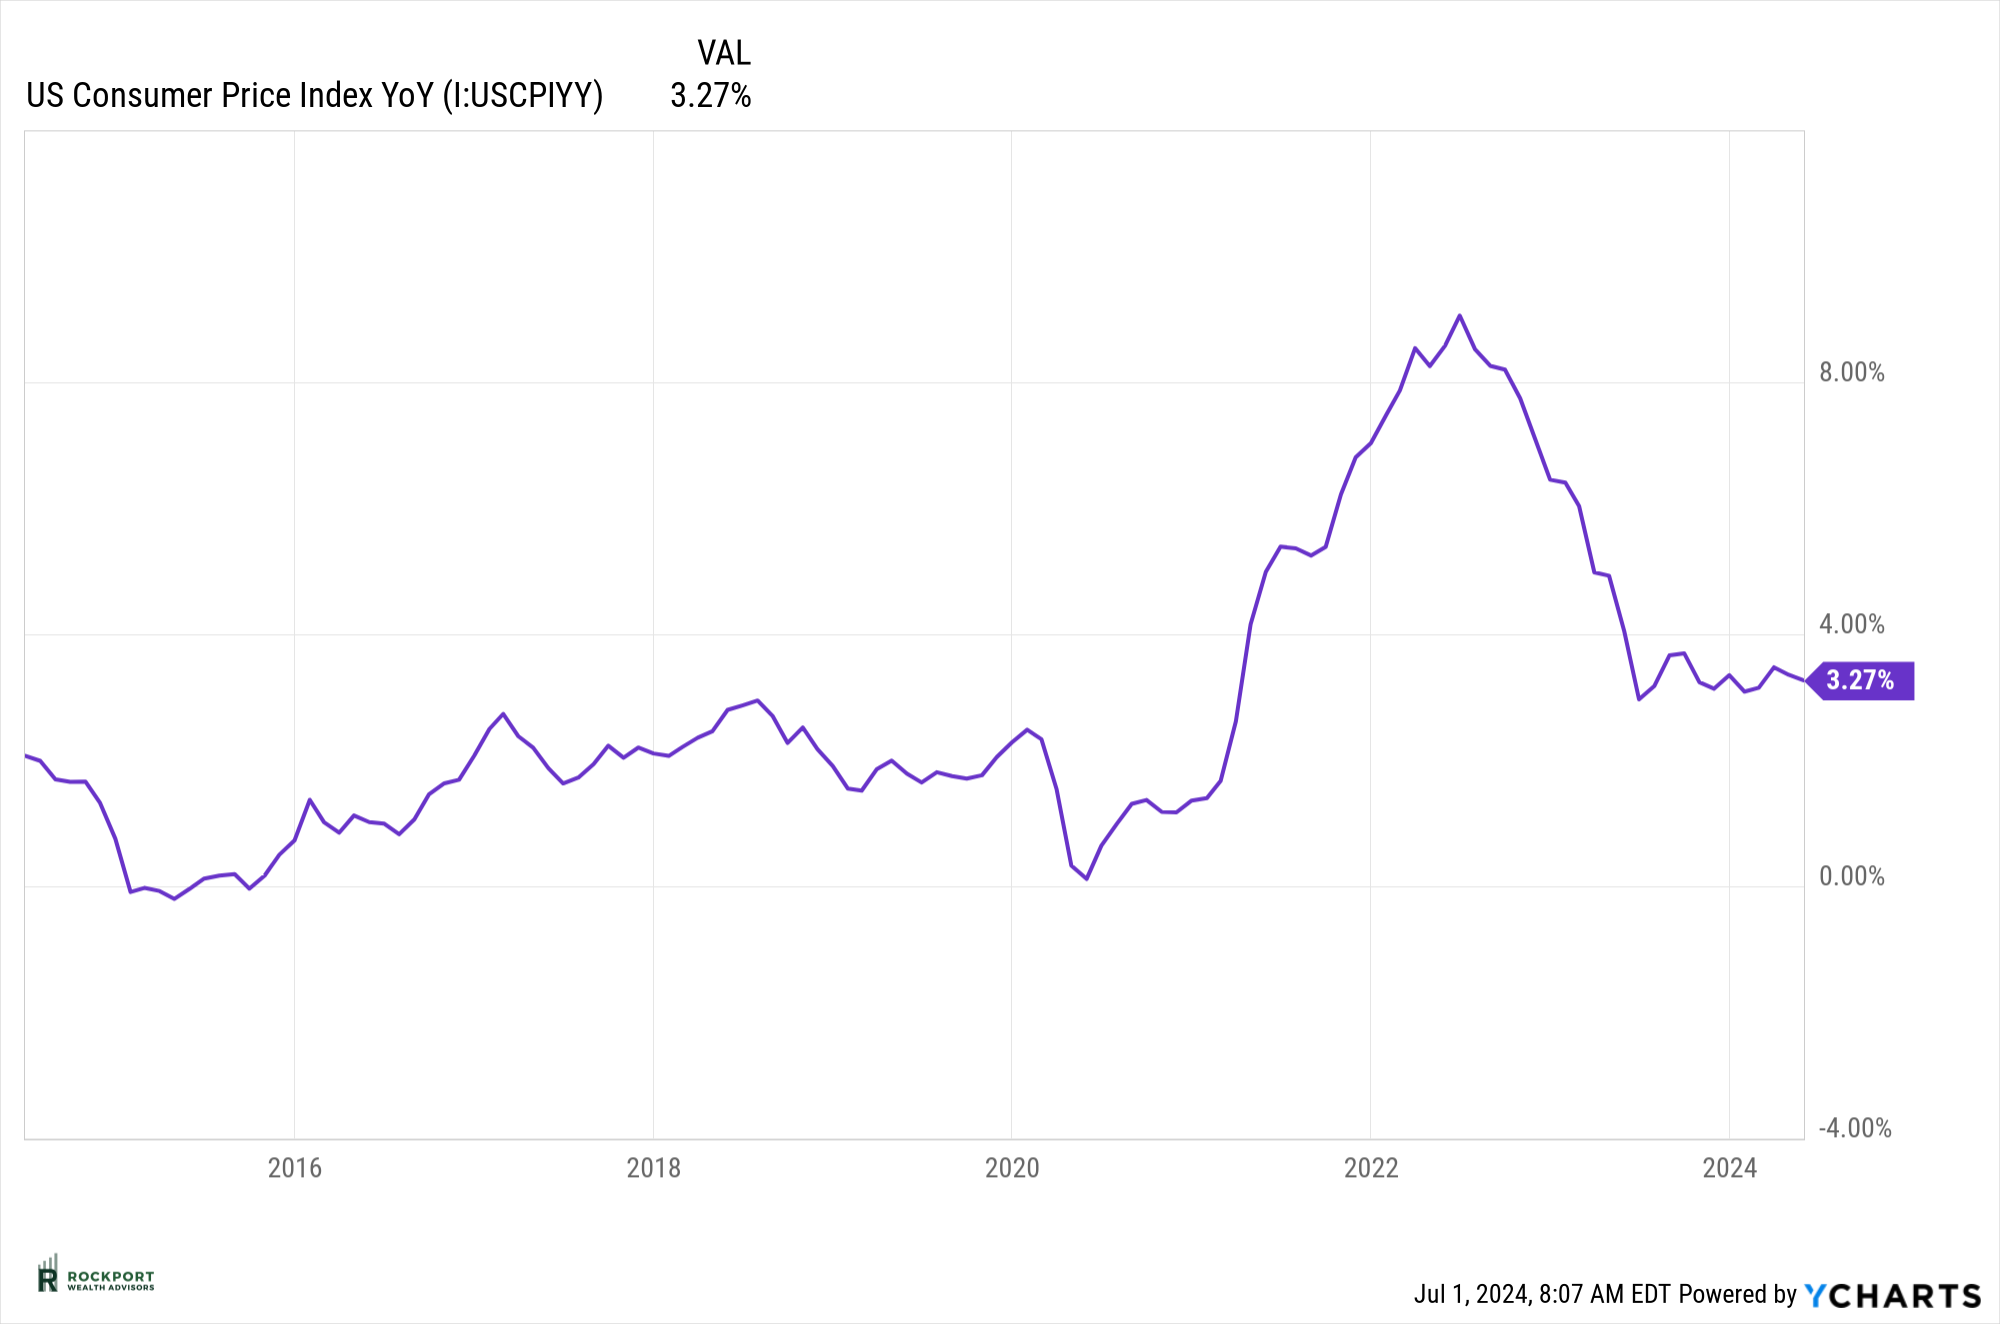
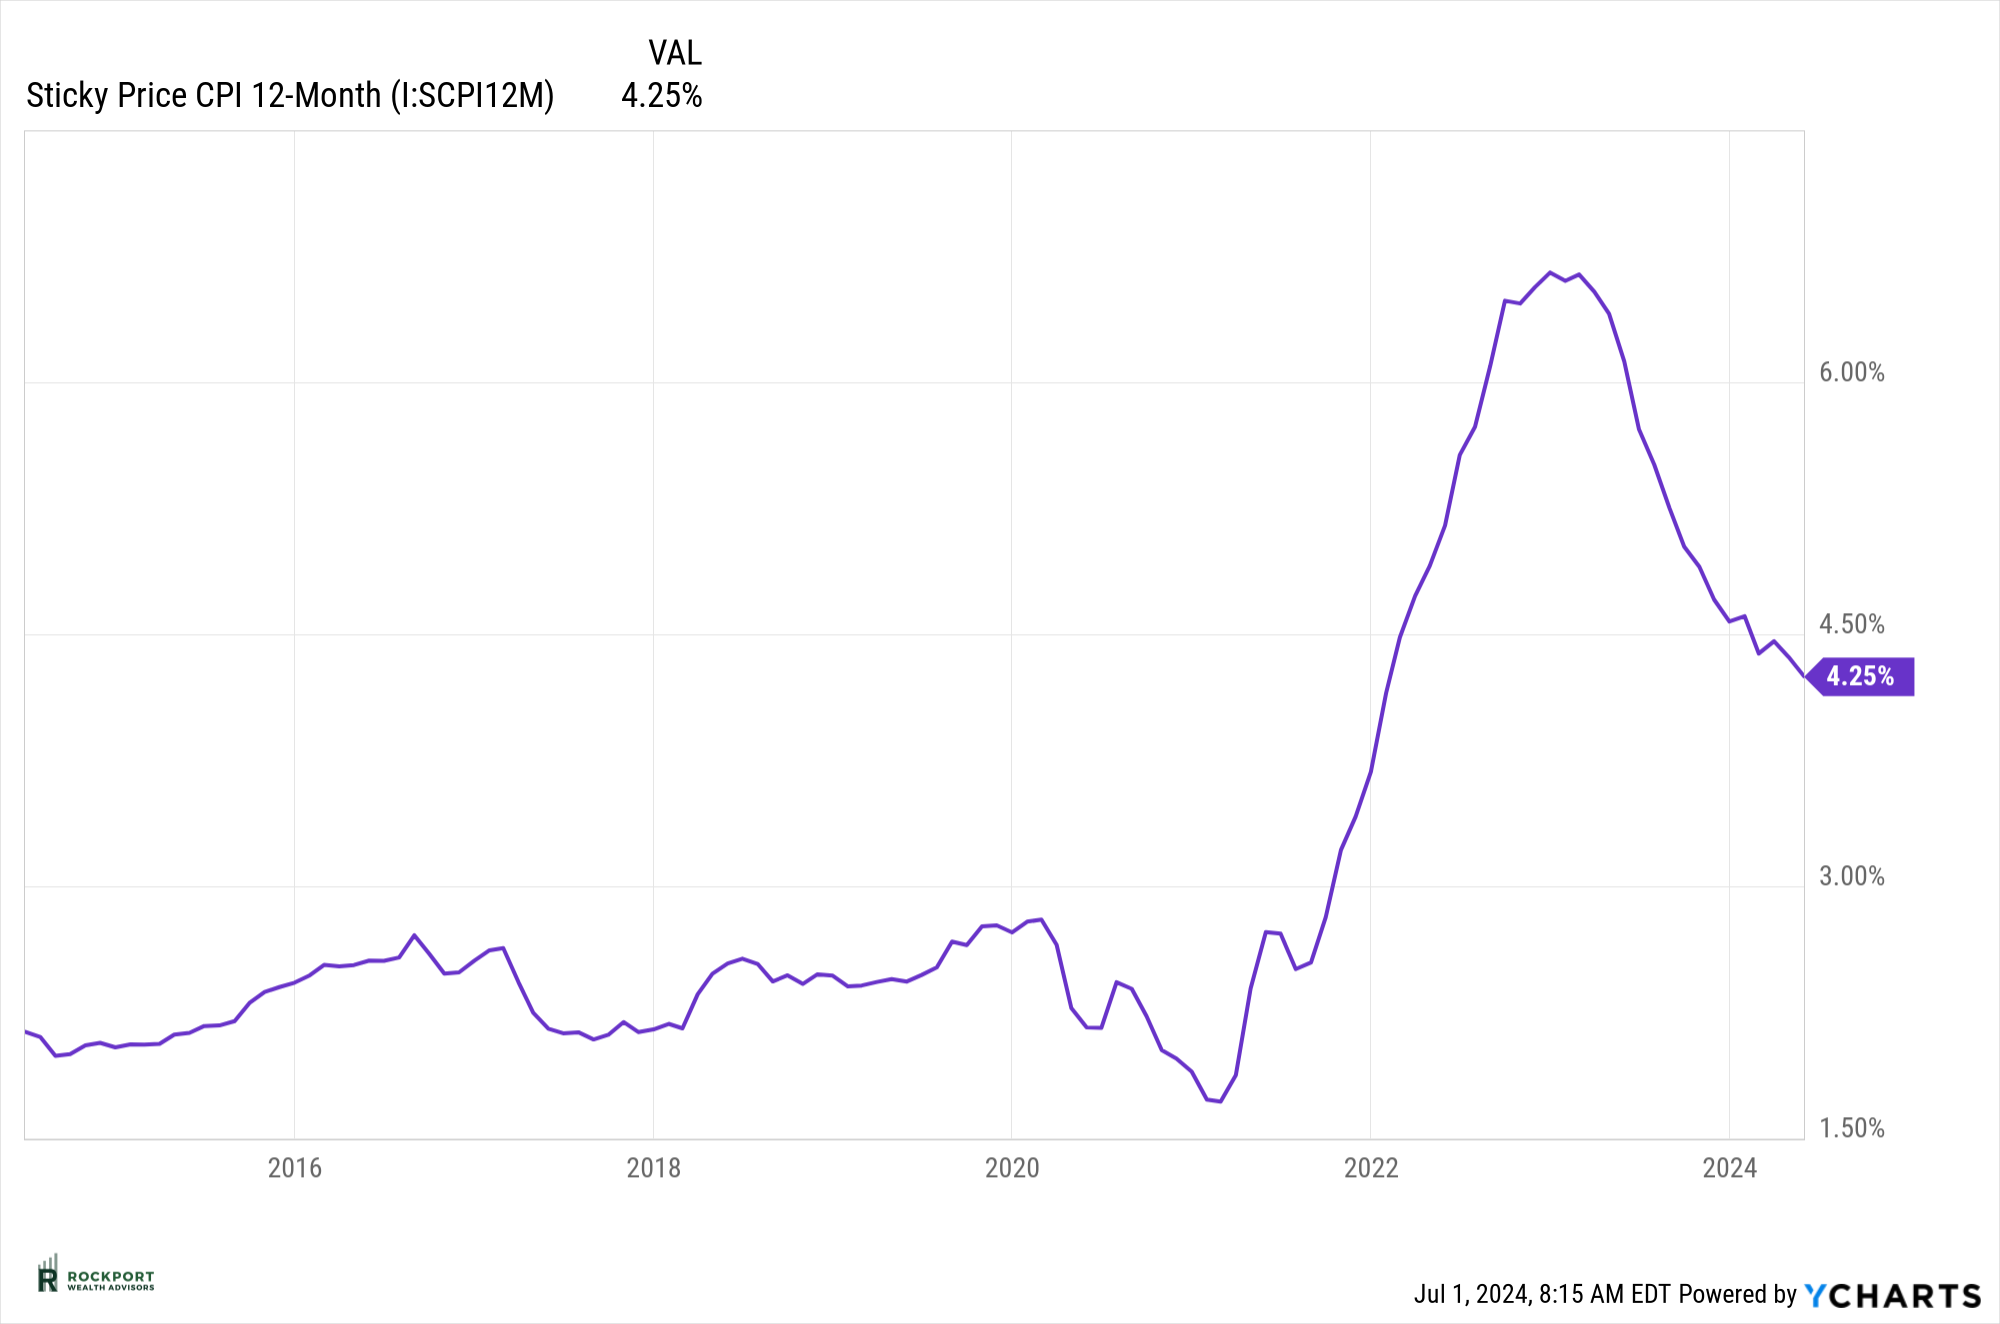
We believe economic headwinds are continuing to escalate. This past month, Consumer Confidence saw a significant decline, indicating that the previously resilient consumer is becoming more concerned. Additionally, the Consumer Price Index (CPI) has shown no significant improvement since mid-2023. While the CPI is gradually decreasing, it remains elevated. The Federal Reserve still has considerable work ahead to address inflation effectively.
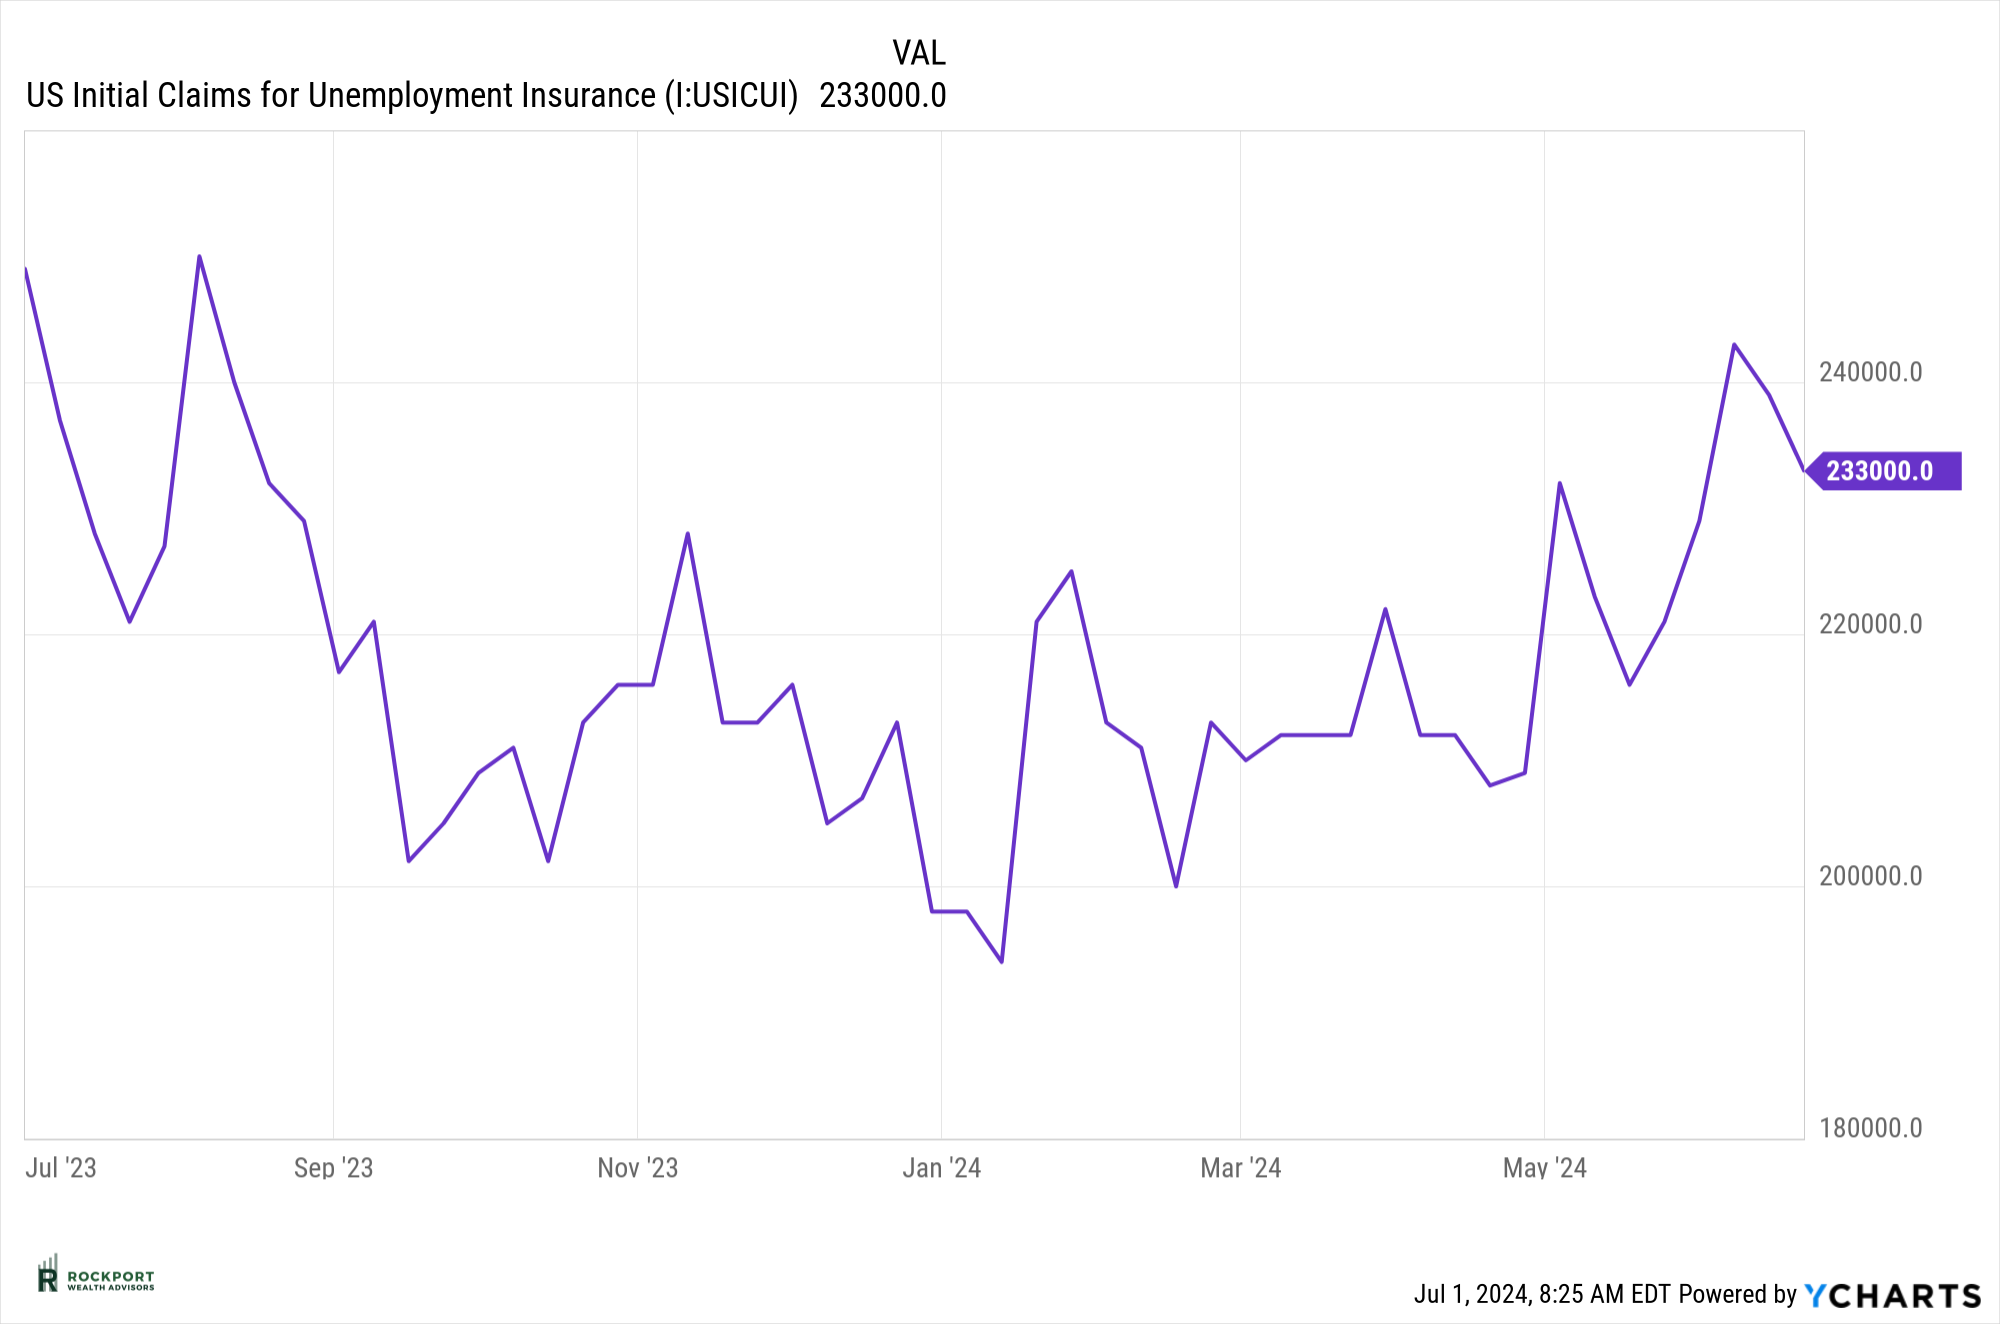
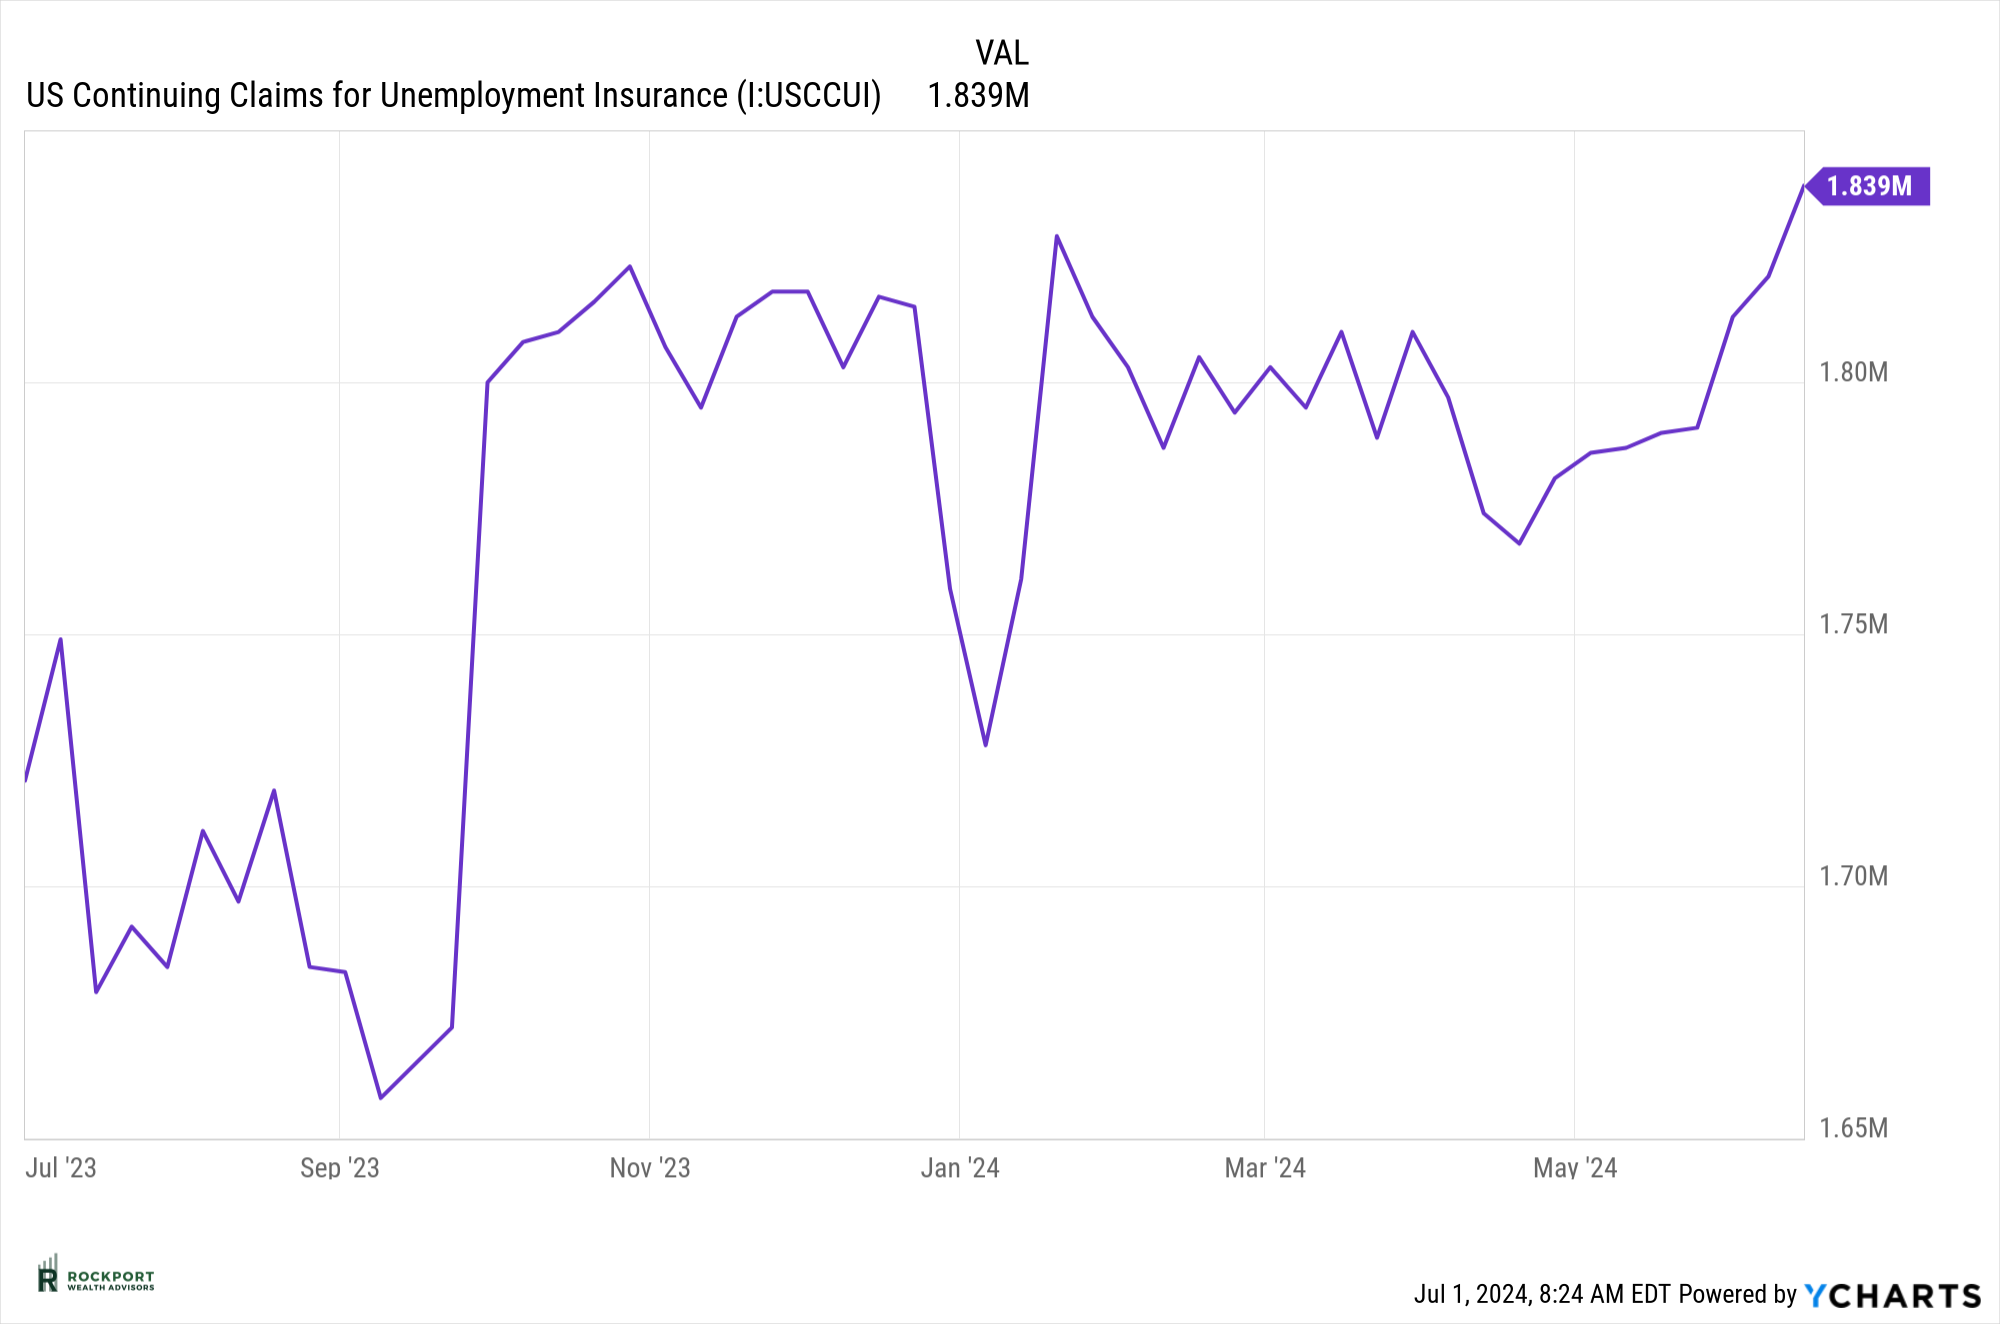
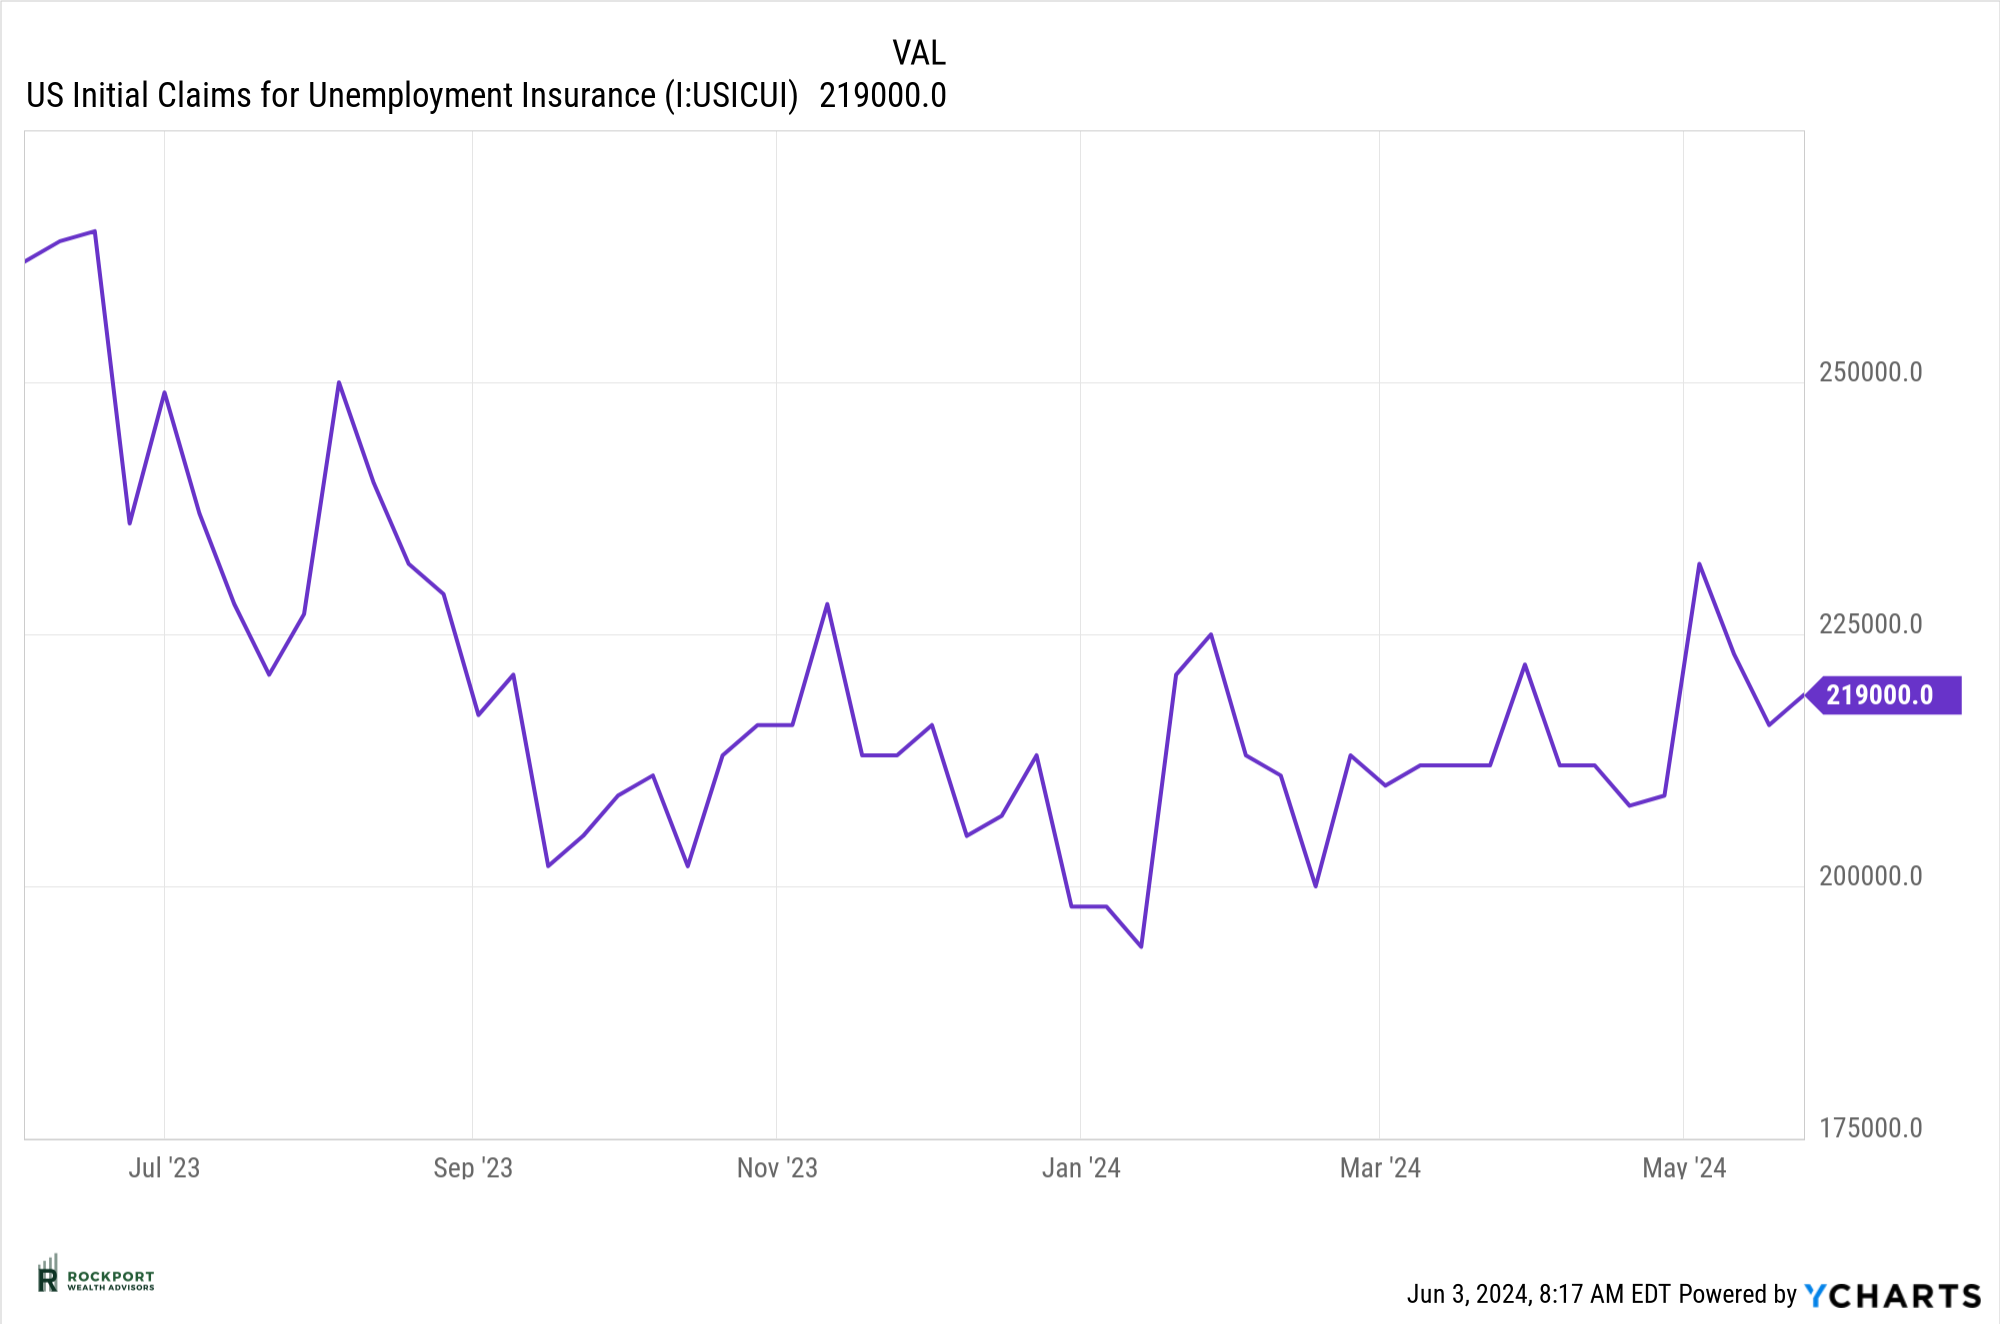
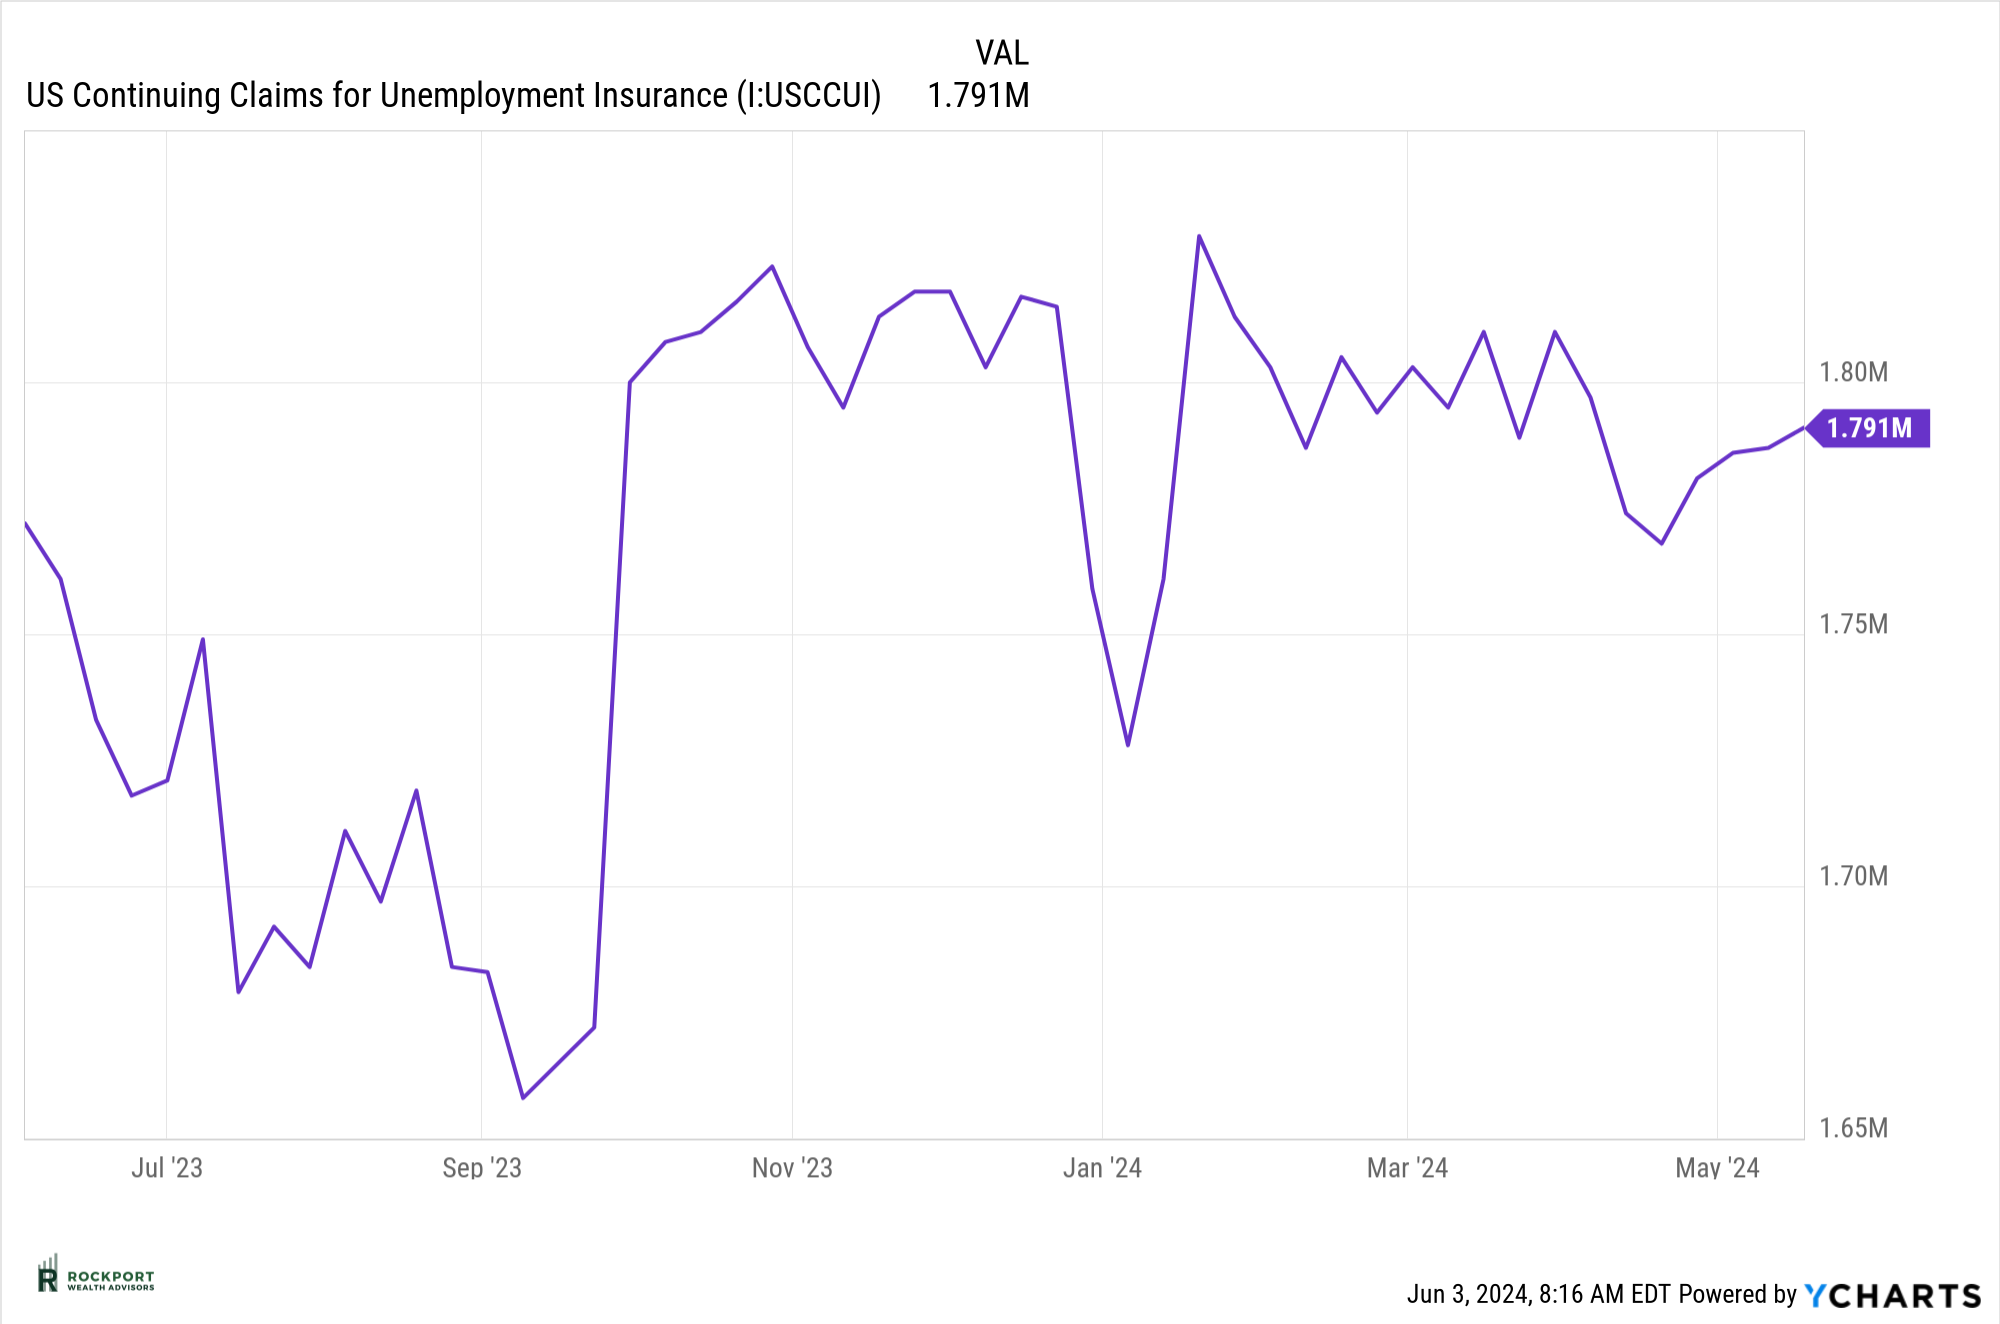
On the employment front, continuing claims for unemployment have noticeably increased to their highest level since April 2023. Meanwhile, initial claims for unemployment have seen a slight decrease. We are closely monitoring these trends as additional layoffs continue to be announced.
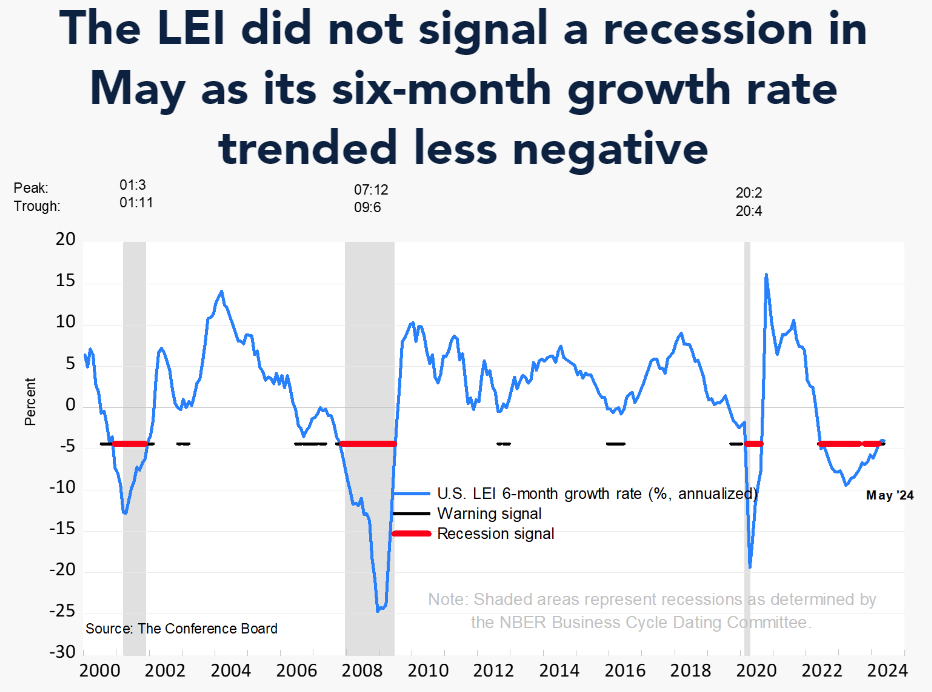
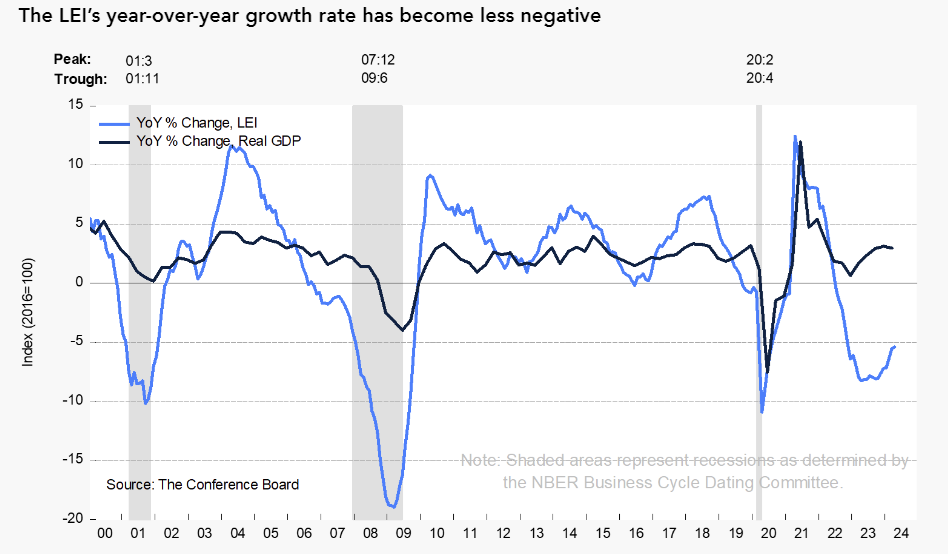
Additionally, the Leading Economic Index hasn’t shown significant improvement, but it is not currently signaling a recession. From the Conference Board : The U.S. LEI fell again in May, driven primarily by a decline in new orders, weak consumer sentiment about future business conditions, and lower building permits,” said Justyna Zabinska-La Monica, Senior Manager, Business Cycle Indicators, at The Conference Board. “While the Index’s six-month growth rate remained firmly negative, the LEI doesn’t currently signal a recession. We project real GDP growth will slow further to under 1 percent (annualized) over Q2 and Q3 2024, as elevated inflation and high interest rates continue to weigh on consumer spending.”
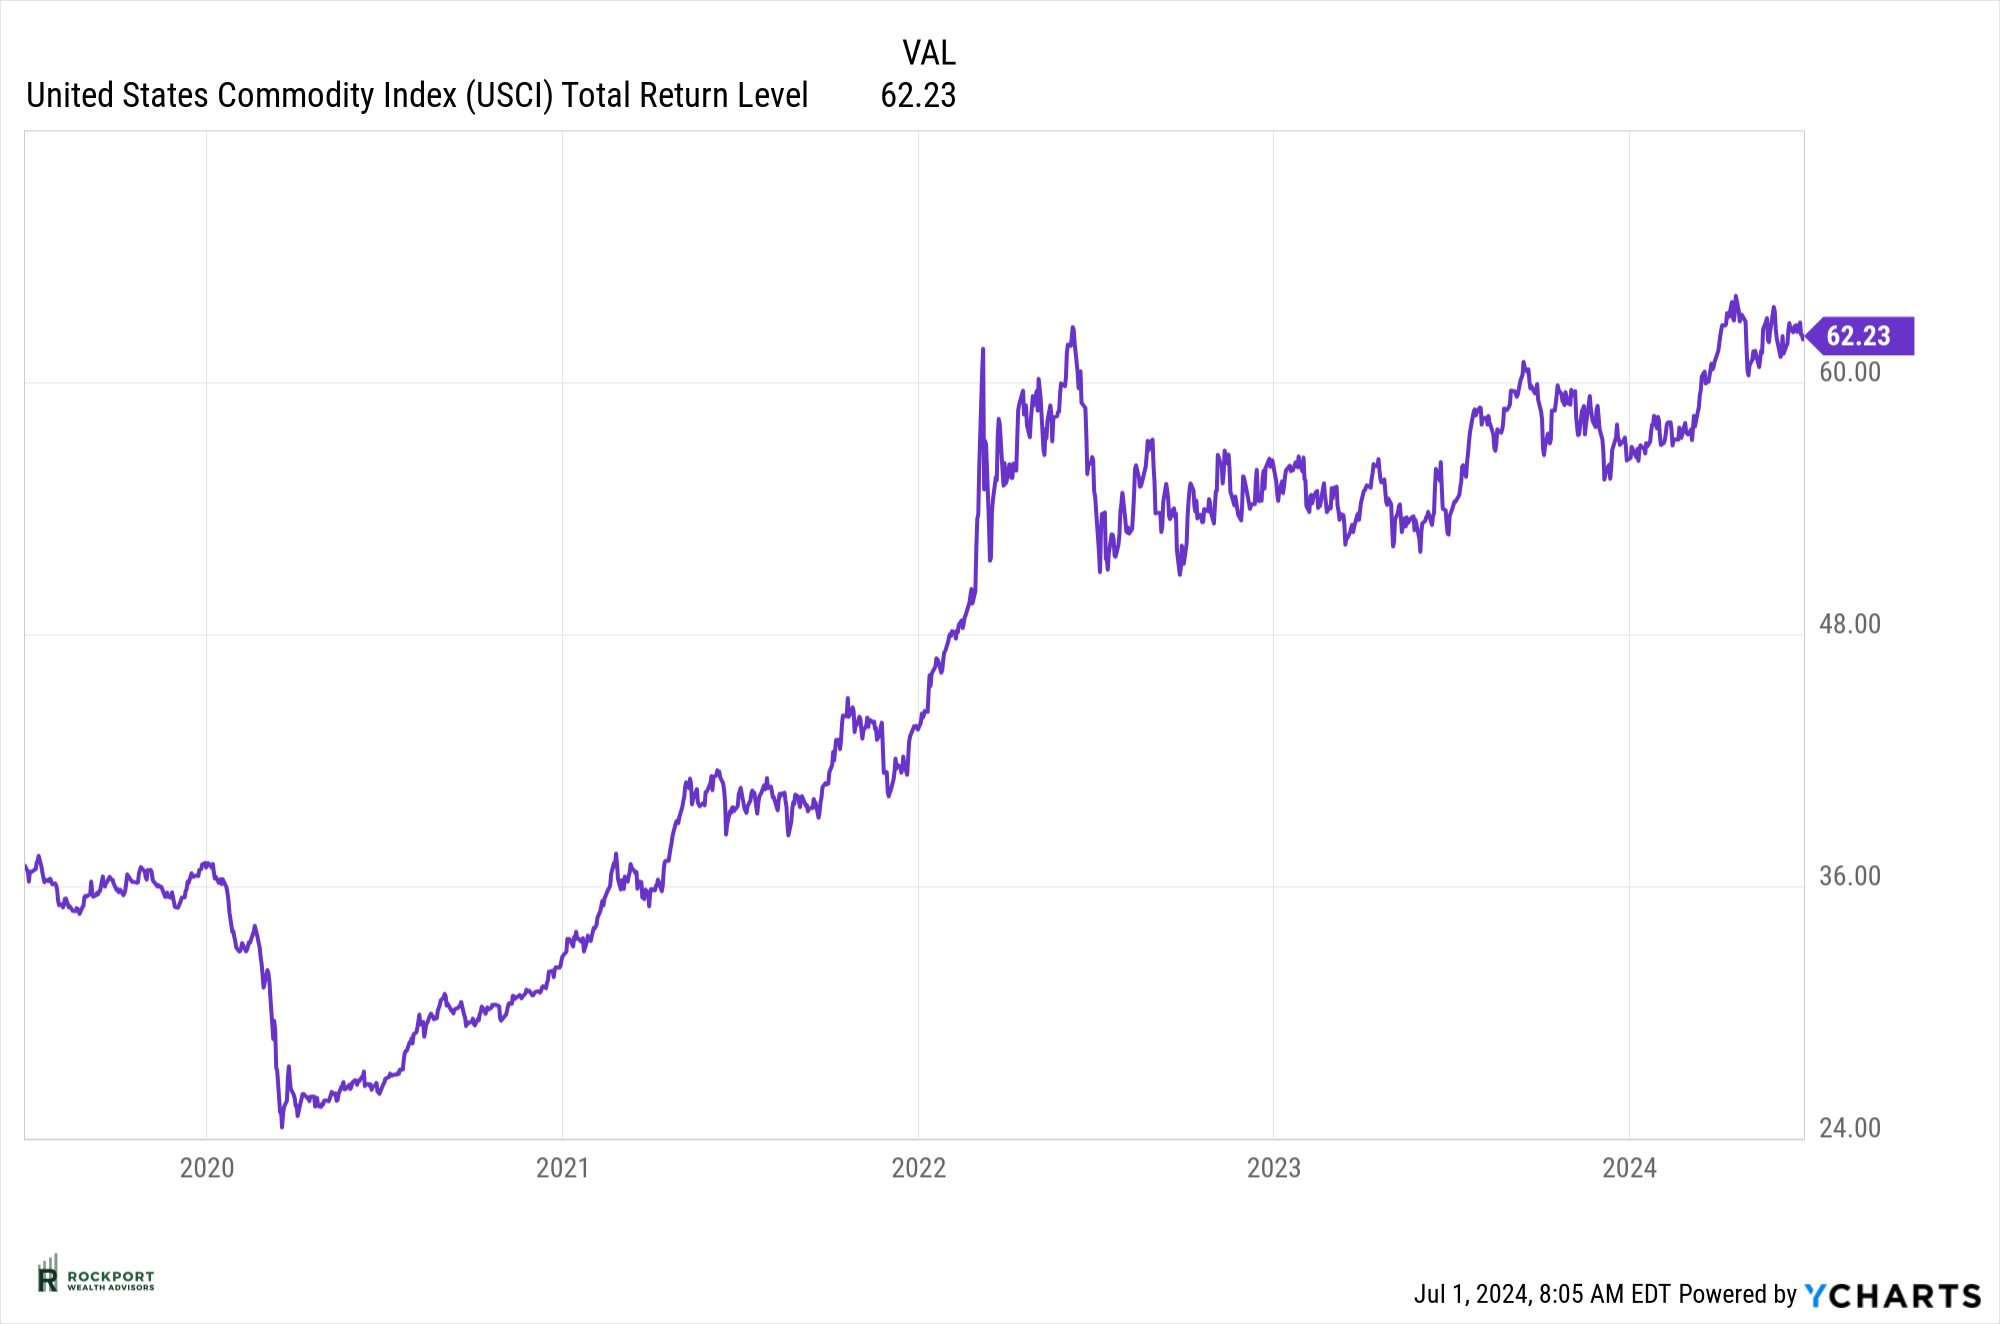
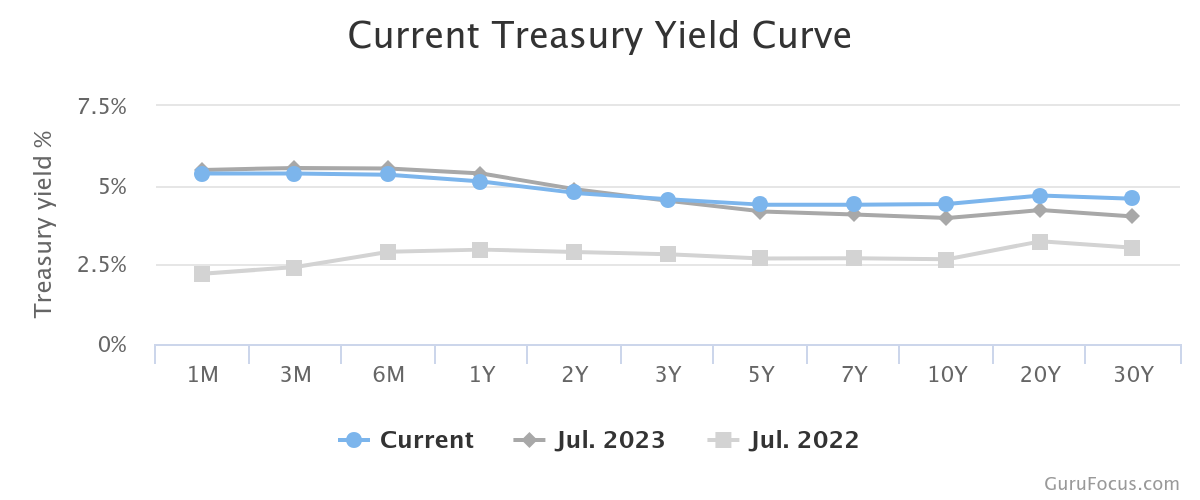
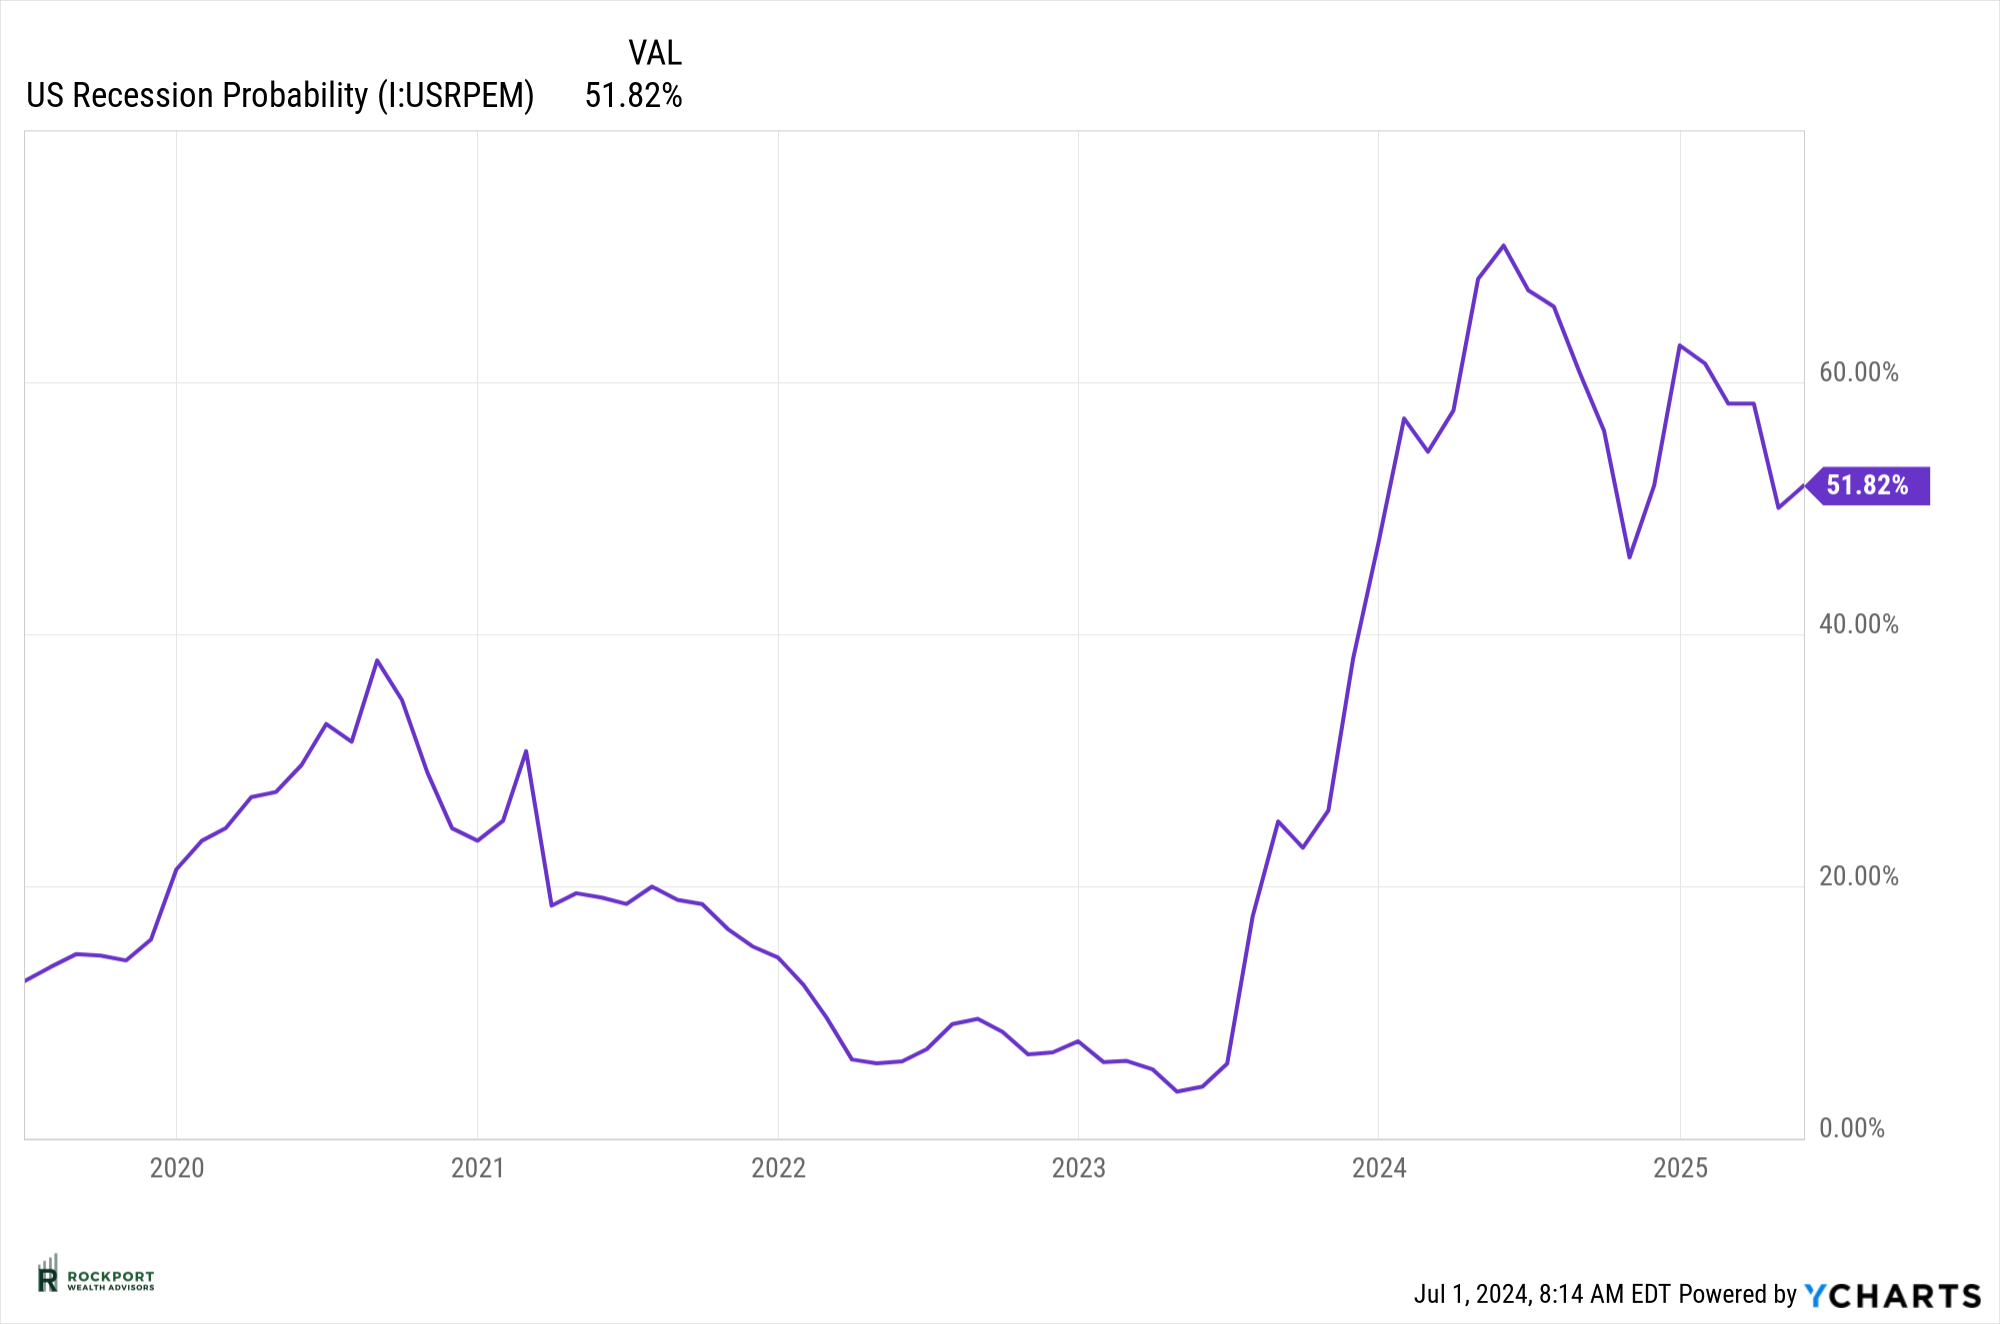
Lastly, commodity prices remain elevated, and the yield curve is still inverted at levels similar to a year ago. The probability of a recession remains historically high. This period may be remembered as either the most well-predicted recession or the greatest miss of all time by economic indicators that typically signal recession. Time will tell.
Lastly, commodity prices remain elevated, and the yield curve is still inverted at levels similar to a year ago. The probability of a recession remains historically high. This period may be remembered as either the most well-predicted recession or the greatest miss of all time by economic indicators that typically signal recession. Time will tell.
Tax Talk
4 WAYS TO REDUCE YOUR RMD TAX BITE
Markets continue to climb. That is good news for your retirement account. However, there is a downside. When you contribute to a traditional IRA or a pre-tax 401(k), you make a deal with Uncle Sam. You can get a tax deduction and tax deferral on any earnings in your account. However, eventually the government is going to want its share and will require funds to come out of these accounts. That is when you must start required minimum distributions (RMDs). You may not need the money, and you may not want the tax hit. Bigger retirement account balances can mean larger tax bills. Here are some strategies that can help reduce your RMD tax bite.
1: Do a Qualified Charitable Distribution (QCD)
If you are planning on giving money to charity anyway, why not do a Qualified Charitable Distribution (QCD) from your IRA? For 2024, if you are age 70 ½, you may transfer up to $105,000 annually from your IRA to a charity tax-free. The QCD can also satisfy your RMD (if the QCD is made before the RMD is taken), but without the tax hit. QCDs are not available from employer plans.
2: Use the Still-Working Exception
Are you still working after age 73? If you do not own more than 5% of the company where you work and the company plan offers a “still working exception,” you may be able to delay taking RMDs from your company plan until April 1 following the year you retire. The still-working exception is not available for IRAs but if your plan allows, you can roll your pre-tax IRA funds to your plan and delay RMDs on these funds too. Just be careful. If you have an RMD for that year from your IRA, you must take it before you can roll over the rest of the funds.
3: Consider a Qualified Longevity Annuity Contract
A Qualifying Longevity Annuity Contract (QLAC) is a product designed to help with longevity concerns. Any funds you invest in the QLAC are not included in your balance when it comes to calculating your RMDs until you reach age 85. This will reduce your RMDs. SECURE 2.0 has changed the rules for QLACs by increasing the dollar limit and doing away with restrictions on the percentage of the account limits. The maximum QLAC limit is now $200,000 per person.
4: Convert to a Roth IRA
If reducing the taxation of RMDs is a top concern for you, you may want to consider a Roth IRA conversion or an in-plan 401(k) conversion. This is because you are not required to take RMDs from your Roth IRA or Roth 401(k) during your lifetime. Keep in mind you will need to take your 2024 RMD from your traditional IRA prior to converting to a Roth IRA. Also, both Roth IRA conversions and in-plan 401(k) conversions are taxable events. There is a big payoff though. You will never have to worry about the tax bite of an RMD ever again.
Rockport News
Salute To Service Golf 2024
Lastly, our annual Salute to Service Golf outing benefiting our veterans is August 12th at Red Tail Golf Club in Avon, Ohio. With this years event we are proud to be supporting two wonderful veteran organizations, GallantFew and the National Veterans Memorial and Museum. Thank you to those who have graciously contributed already. If you would like to donate or sign up a group to golf please visit www.salutetoservicecegolf.com.
As always, if you have any questions on anything we have talked about here or anything else that is on your mind, please feel free to reach out.
1 Tradethatswing.com – “Seasonla Patterns of the Stock Market”
*The Standard & Poor’s 500 (S&P 500) is an unmanaged group of securities considered to be representative of the stock market in general. Results can be found at slickcharts.com.
*Treasury yields can be found at finance.yahoo.com.
*Charts produced at yCharts.com
*Bonds can be found at bloomberg.com/markets/rates-bonds
*Fed Rate Probability Chart can be found at cmegroup.com/markets/interest-rates/cme-fedwatch-too
*The LEI can be found at conference-board.org/topics/us-leading-indicators
*Treasury Yield Curve can be found at Gurufocus.com
*University of Michigan Consumer Confidence produced at SentimenTrader
*Rockport Models – Please remember we are referencing our model portfolios, and your portfolio may differ from the models mentioned depending on your individual needs and circumstance.