Markets & Economy
In the previous month’s newsletter, we began by discussing the historical performance of the stock market during August and September, highlighting September as the weakest month. We also mentioned that the markets experienced a minimal decline in August. As anticipated, September followed historical patterns, with the S&P 500 index decreasing by -4.87%. Despite this decline, the index remains up by 11.68% for the year. However, when you exclude the seven exceptional stocks we’ve frequently discussed throughout the year, overall stock market returns have been relatively flat. The Aggregate Bond Index saw a decline of -2.85%, resulting in a year-to-date decrease of -3.04%. The S&P 500 equal weight index, a better representation of the overall market, also performed poorly, with a -5.49% decline for the month and a minimal 0.31% year-to-date gain.
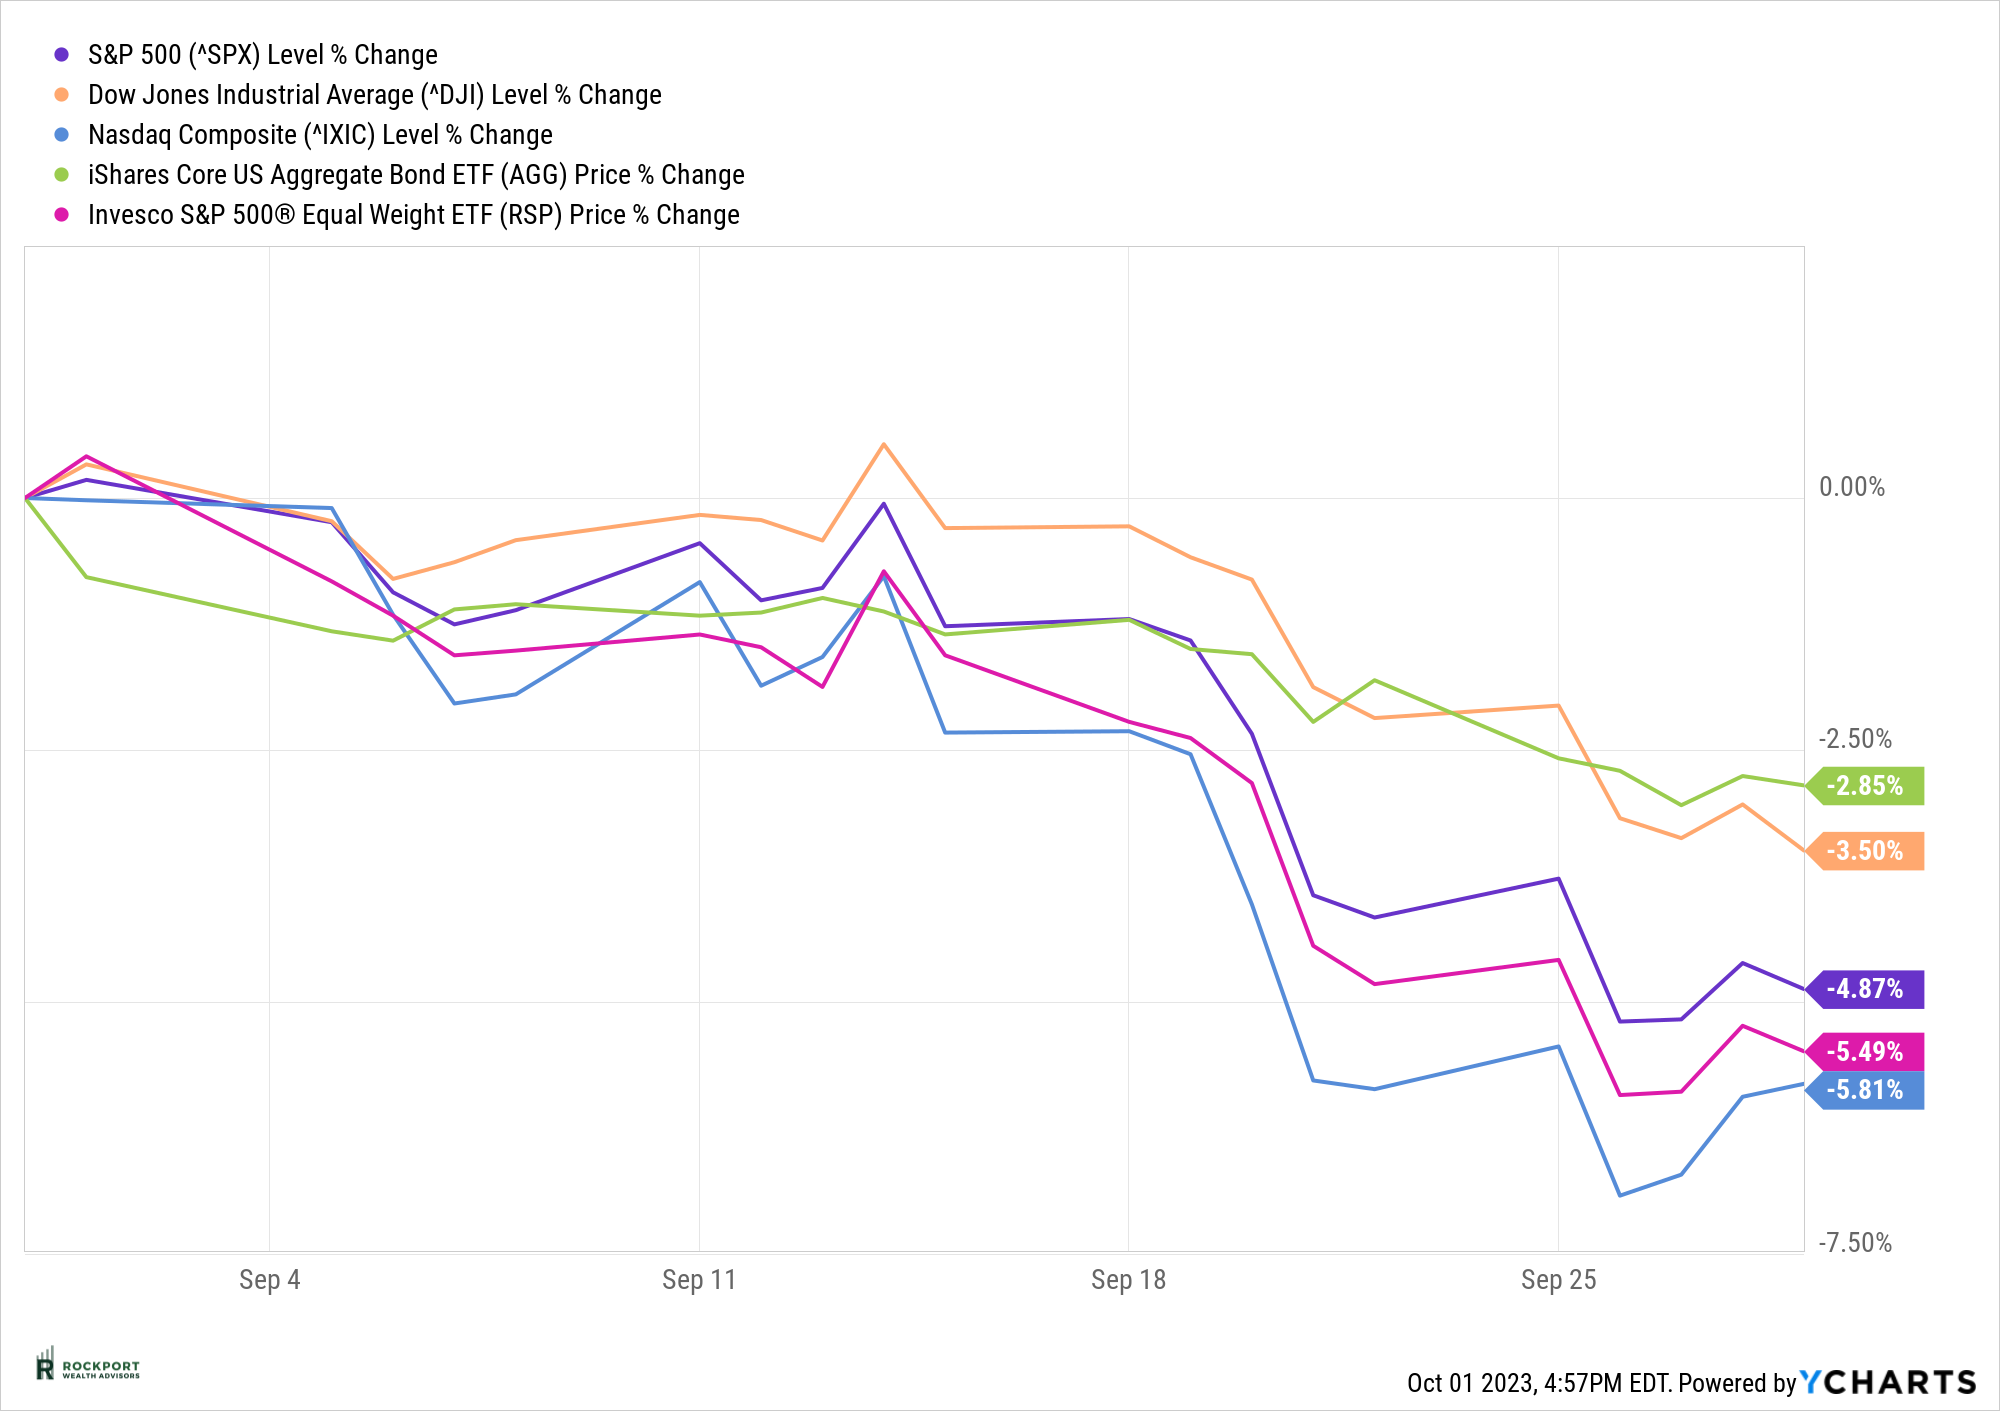
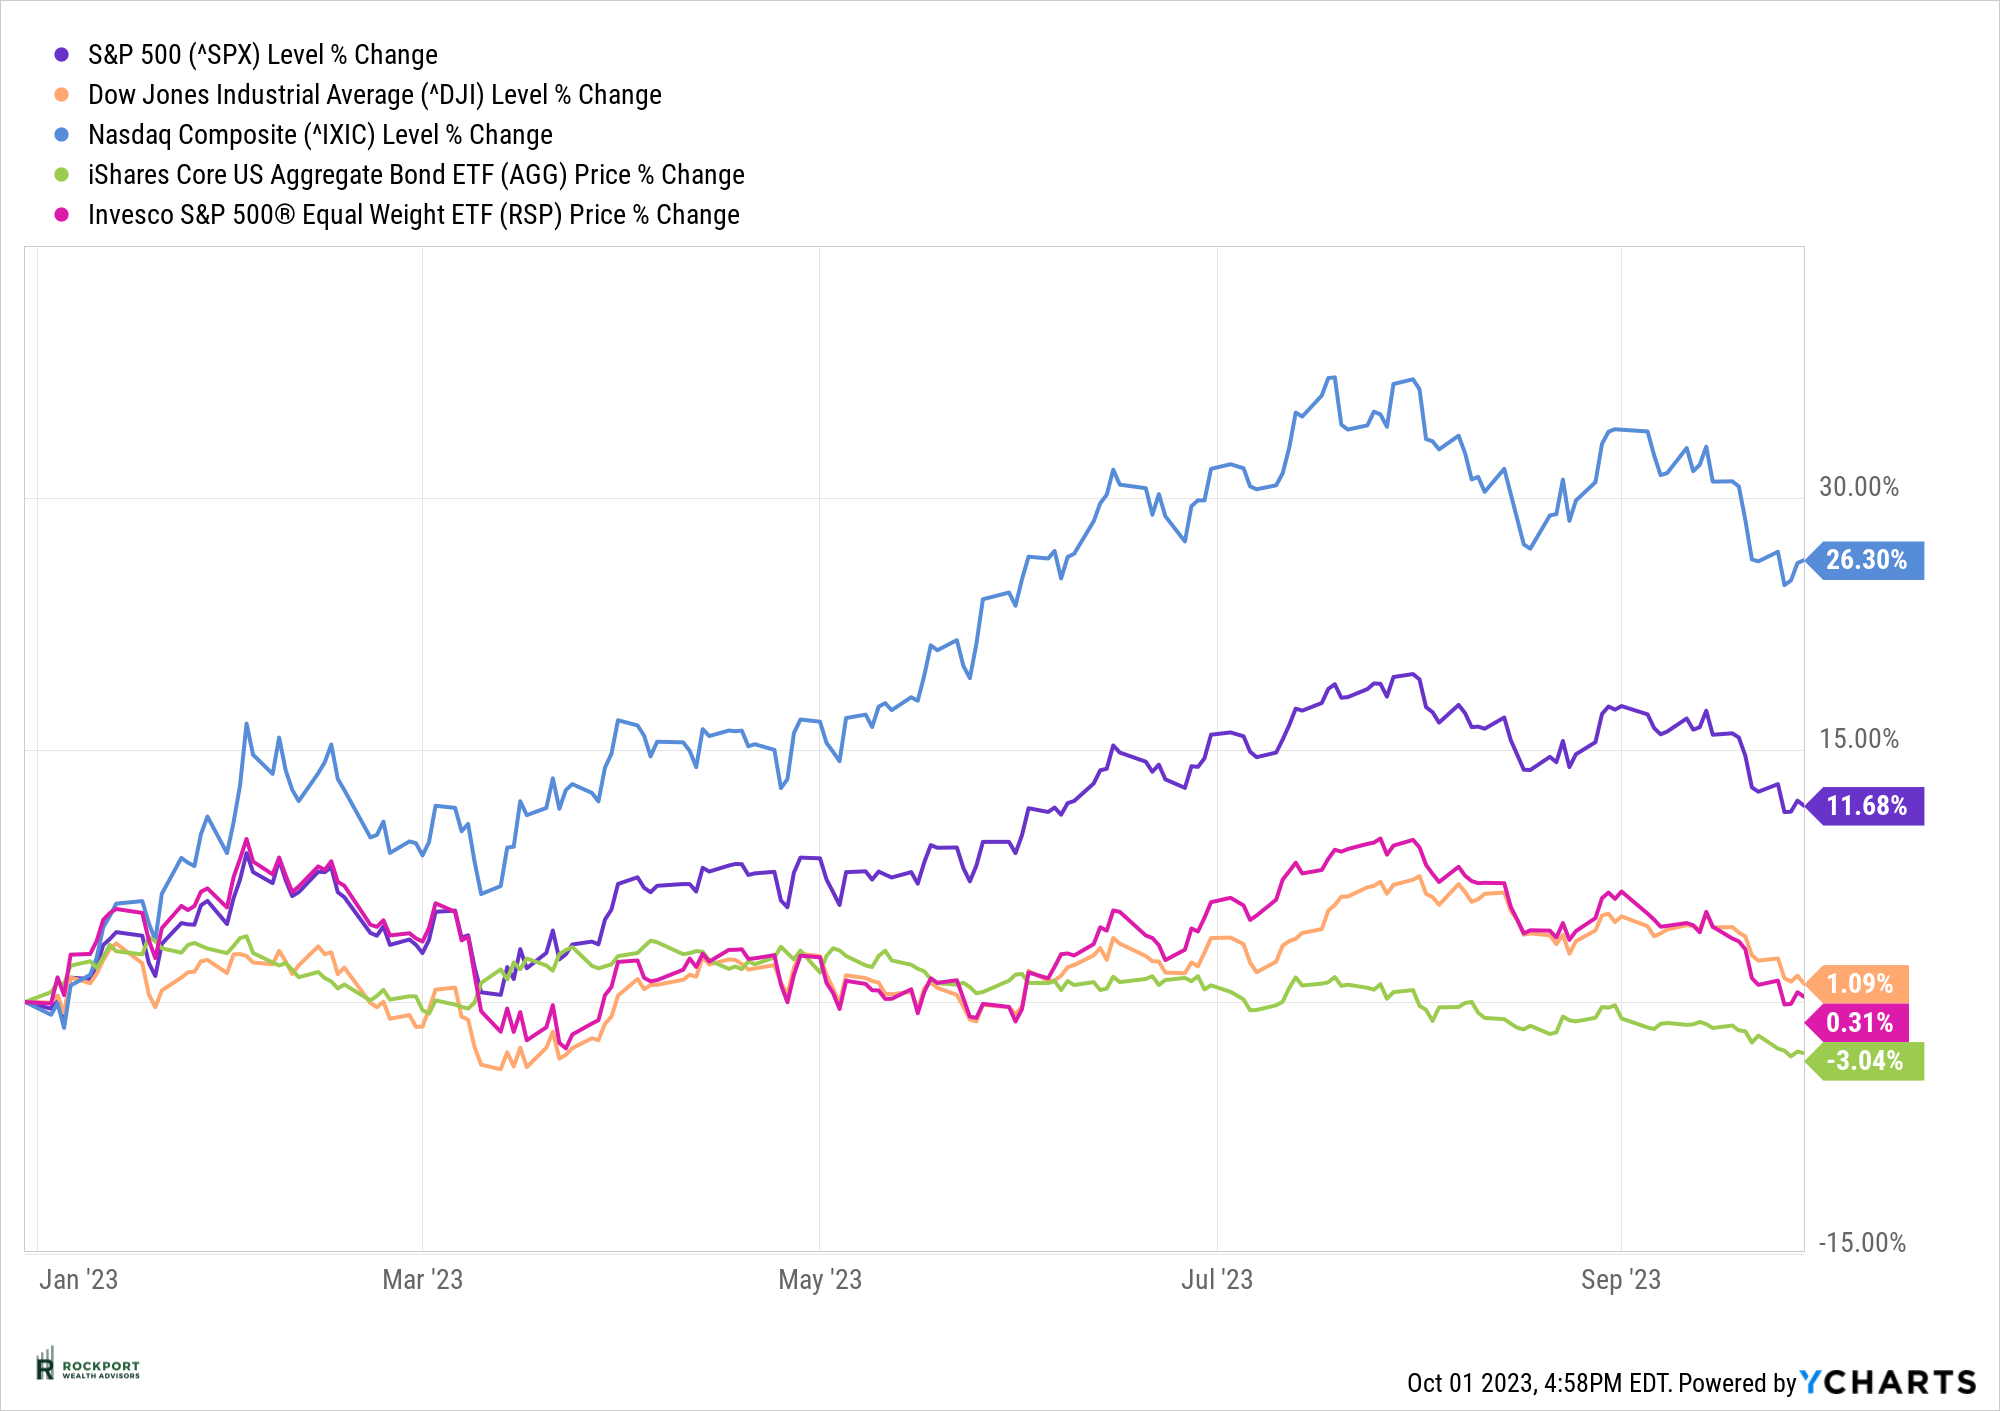
As we enter the fourth quarter, the market has a slightly negative tone, which is not unusual given the typical seasonal weakness in the past two months. We are sharing this information not to focus on the negative aspects but rather to provide insight into market performance and its direct impact on portfolio returns. Currently, there appears to be a significant disconnect between market performance and investor expectations, which might be influenced by media coverage. Many TV shows, such as CNBC’s Fast Money, emphasize day-to-day market fluctuations and immediate financial decisions. It’s possible that the advisor community is also partially responsible, potentially losing sight of the message that long-term performance is about achieving an average rate of return over extended periods, which is what financial planning aims to accomplish. Regardless of the reasons behind this disconnect, there seems to be a high level of surprise among investors regarding their year-to-date account performance compared to the performance numbers we mentioned above.
Undoubtedly, the past two years have been challenging for investors, offering few hiding places and limited opportunities for gains. However, it’s essential to remember that this situation won’t last indefinitely. Even during the most challenging times, markets have eventually recovered and reached new highs. We see no reason why this time would be any different. Patience will be the key to achieving success.
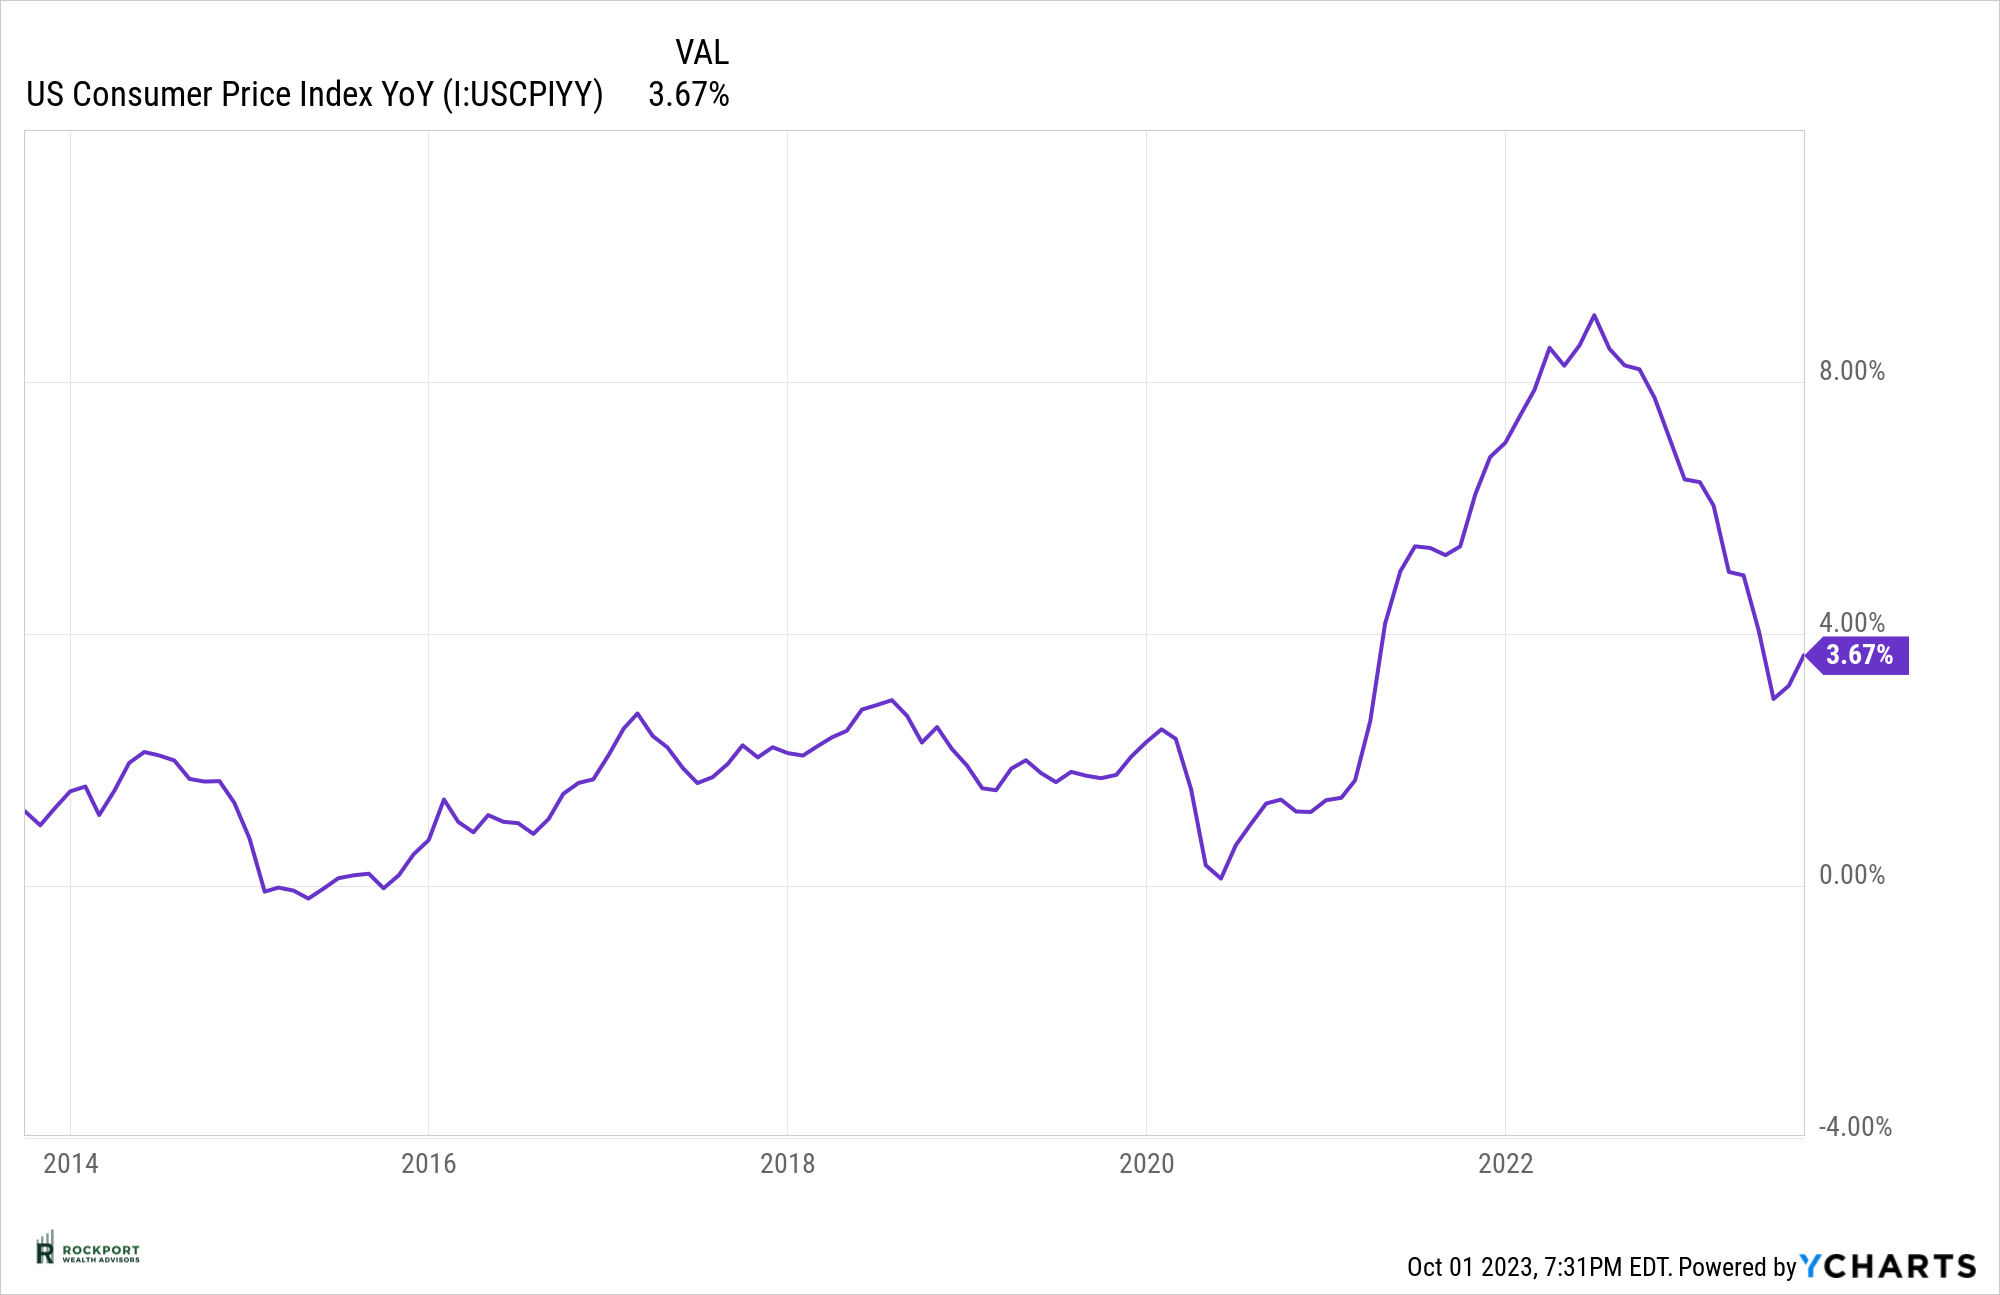
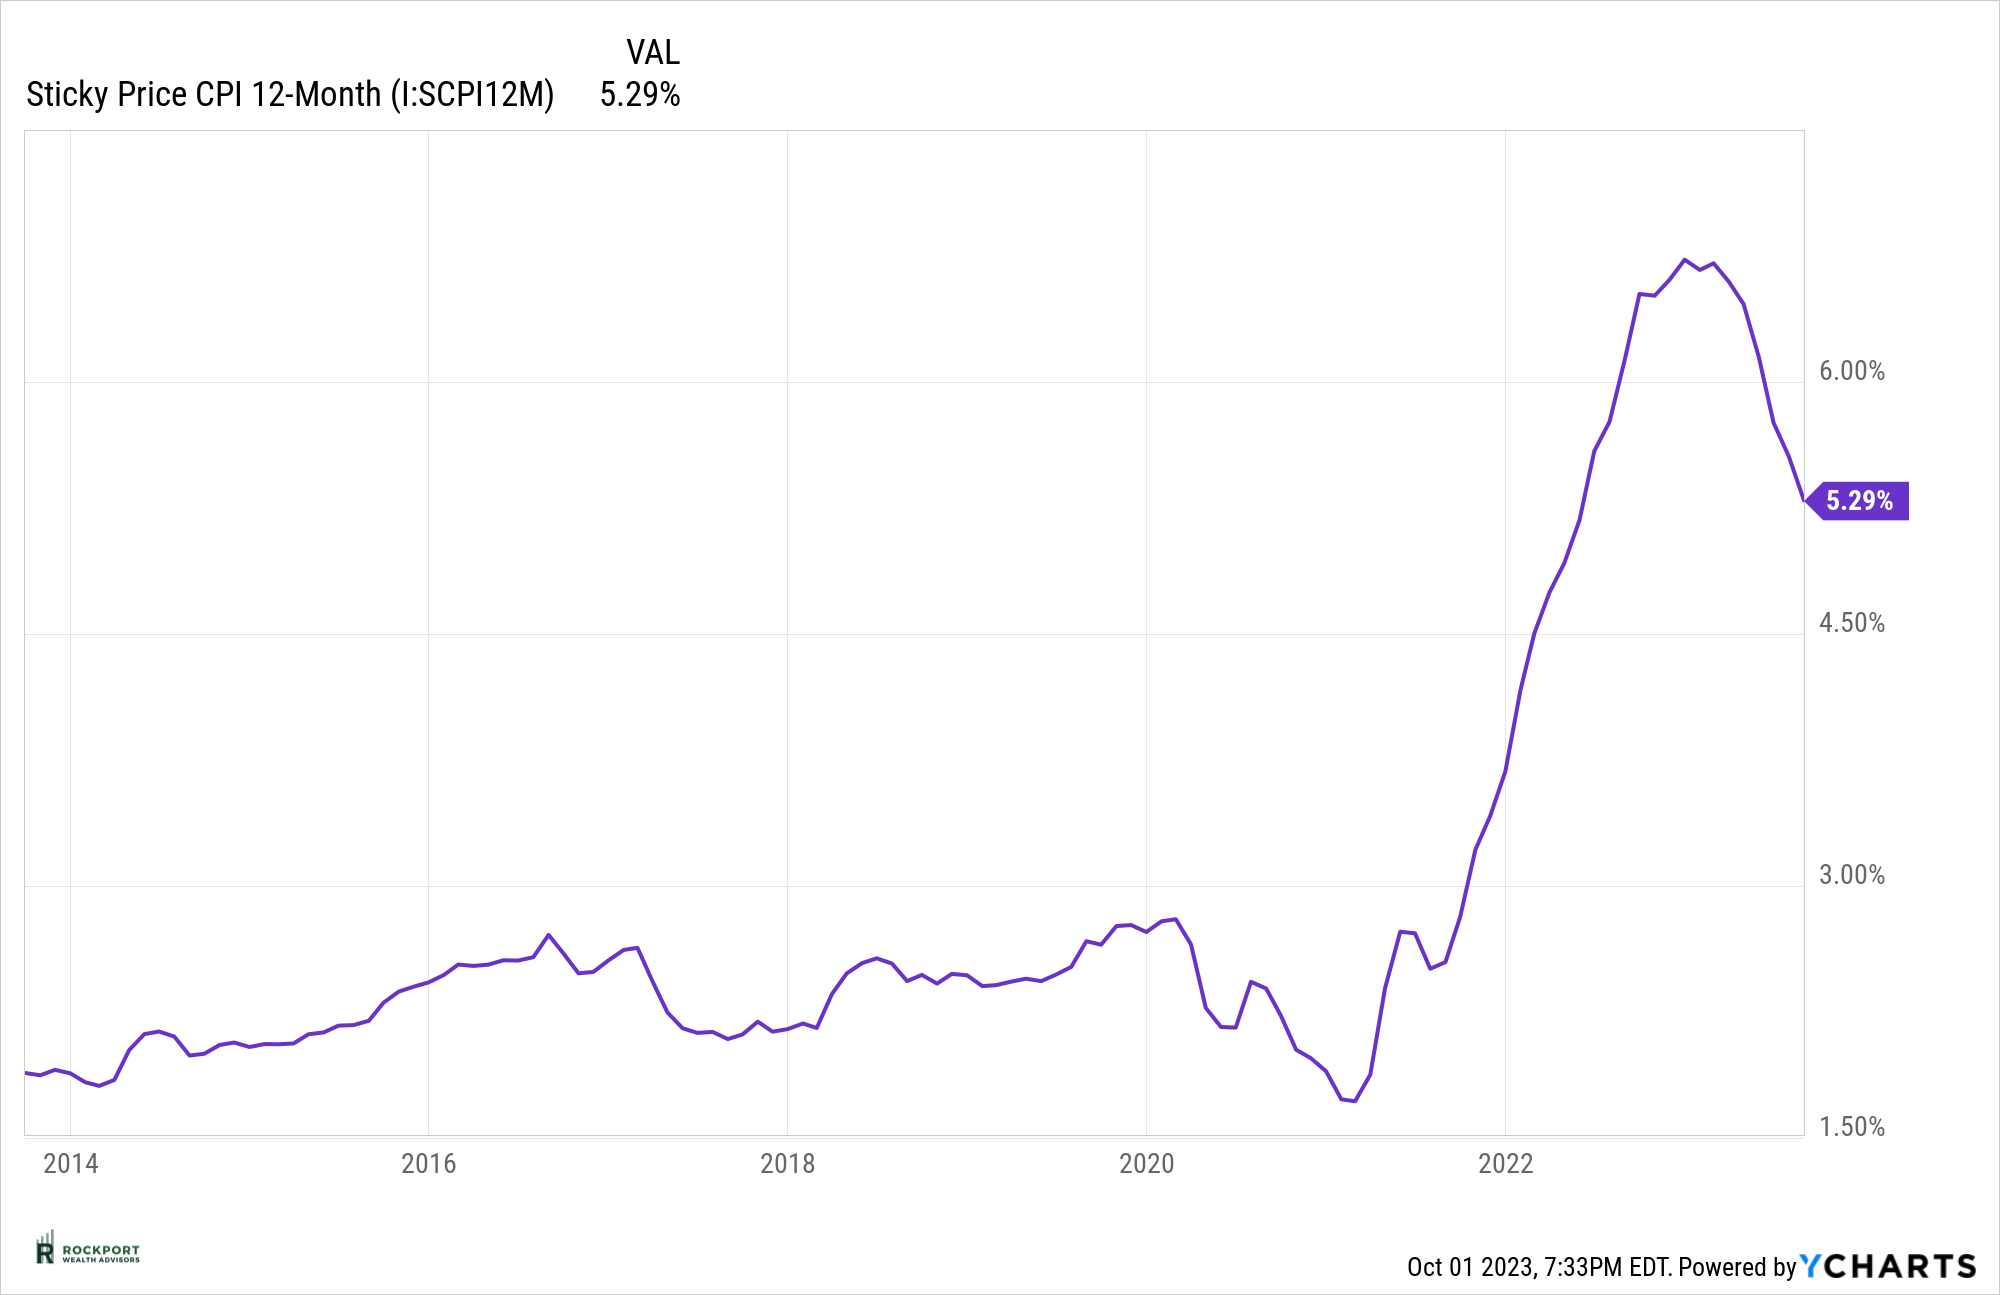
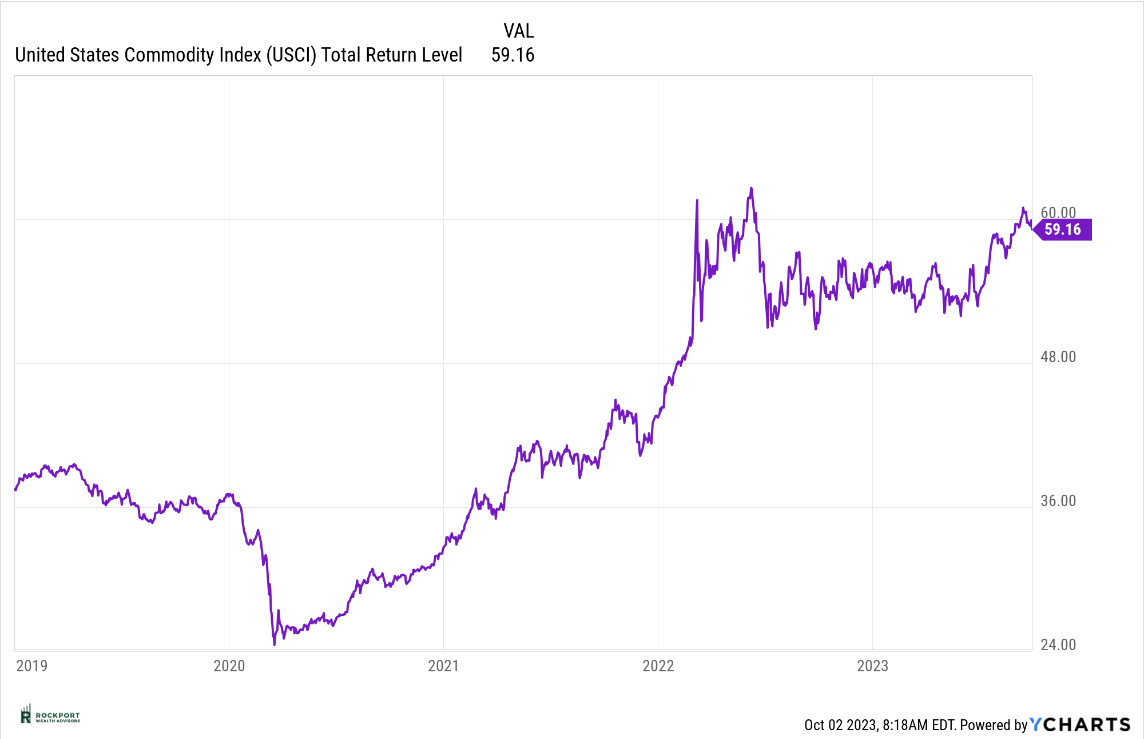
Providing a brief update on some of the key data points we’ve closely monitored over the past year. The Consumer Price Index (CPI) saw another increase last month, rising to 3.67%, while the sticky CPI decreased to 5.29%. These changes, albeit modest, occurred in opposite directions. Commodities have remained at approximately the same level as the previous month, still considerably higher than they were earlier in the year. It’s safe to conclude that inflation persists, certainly more than what the Federal Reserve would prefer.
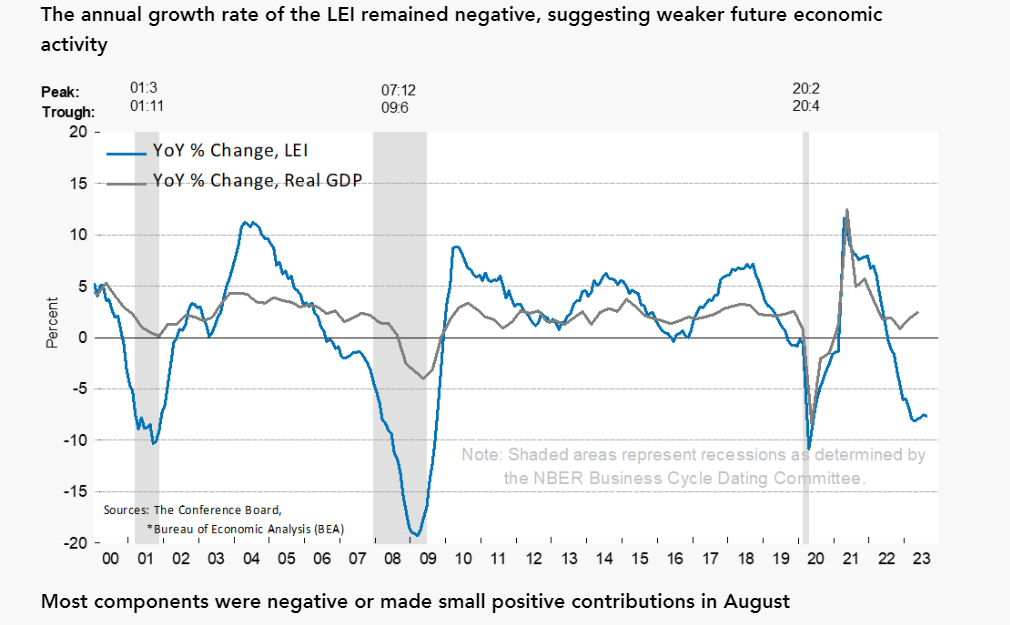
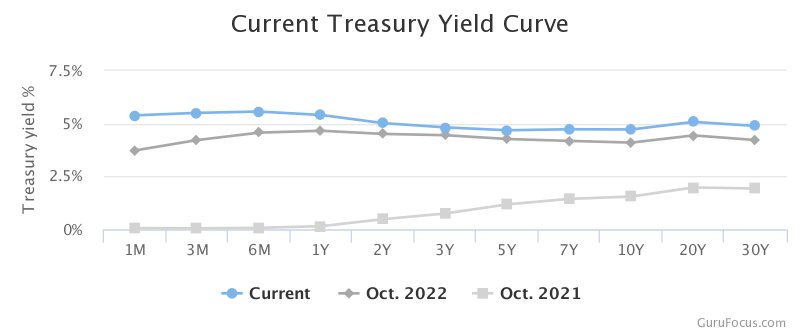
The leading economic index has once again declined, marking nearly a year and a half of continuous decline. The yield curve remains inverted, although it is currently showing signs of un-inverting. This is an intriguing development. While a yield curve un-inversion is favorable in the long term and aligns with the ideal yield curve shape, historically, it has also signaled the onset of a recession.
Turning to the bond market, yields have steadily increased over the past year, with a more rapid uptick observed in August. Undoubtedly, this has unsettled the stock market and led to a decline in bond prices. The silver lining is that once this situation stabilizes, it sets the stage for bond price recoveries and potential capital appreciation, which will greatly benefit more conservative investors. This trend also has implications for various financial matters, such as mortgage rates, which recently surpassed 7.7% for a 30-year mortgage. In short, the cost of borrowing for various purposes has noticeably risen over the past year, contributing to a slower economy. When this situation normalizes, it will be a welcome development.
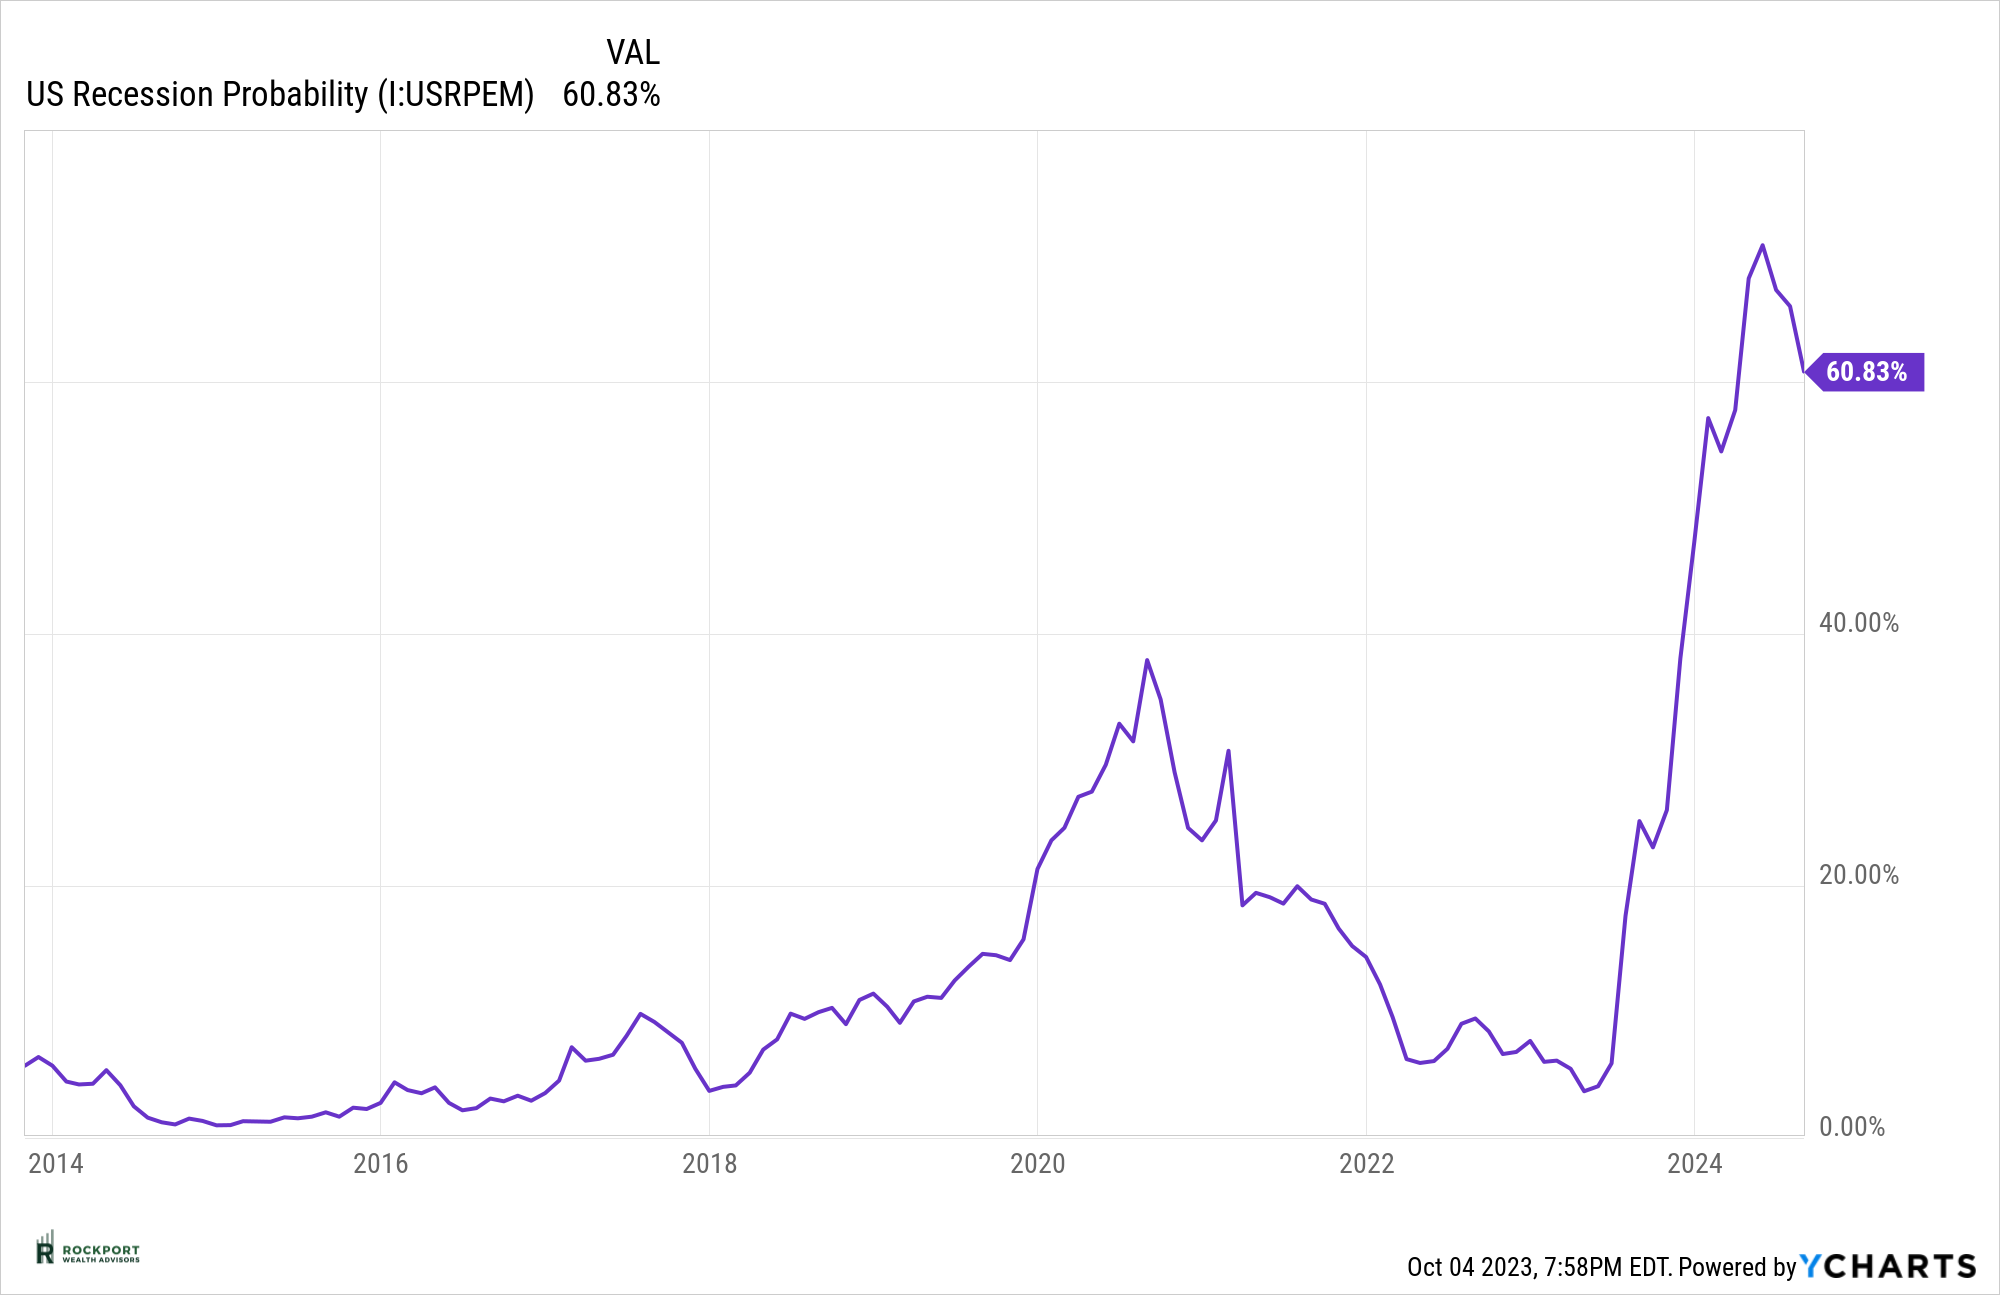
Lastly, let’s address the recession probability model. Although it remains significantly elevated, it has decreased to 60.83%, compared to over 70% in May of this year. The possibility of a recession of some magnitude still appears likely, possibly in the first half of the coming year. However, it’s crucial to remember that nothing in this regard is certain.
Rockport Models
We did make a slight change to the more conservative side in the Sector model. Keep in mind this is our most active strategy with more frequent changes than standard allocation models. If you have any question on this or any other model please reach out.
Industry Topics
Medicare Open Enrollment
Medicare Open Enrollment begins October 15th and ends on December 7th. A lot of people forget to review these important deadlines every year, which can cost you money. We have identified a local Medicare insurance agency to provide comprehensive reviews of all our clients Medicare insurance needs. They are a local industry expert and we are excited to provide this opportunity. They do cover most of the other 50 states as well. If you would like to contact them to have your coverage reviewed please let us know and we will gladly get you in touch.
As always, if you have any questions on anything we have talked about here or anything else that is on your mind, please feel free to reach out.
*The Standard & Poor’s 500 (S&P 500) is an unmanaged group of securities considered to be representative of the stock market in general. Results can be found at slickcharts.com.
*Treasury yields can be found at finance.yahoo.com.
*Charts produced at yCharts.com
*Bonds can be found at bloomberg.com/markets/rates-bonds
*Fed Rate Probability Chart can be found at cmegroup.com/markets/interest-rates/cme-fedwatch-too
*The LEI can be found at conference-board.org/topics/us-leading-indicators
*Treasury Yield Curve can be found at Gurufocus.com
*Rockport Models – Please remember we are referencing our model portfolios, and your portfolio may differ from the models mentioned depending on your individual needs and circumstance.


