
Happy Fall! We hope that this newsletter finds you all Happy and in Good Health!
Markets & Economy
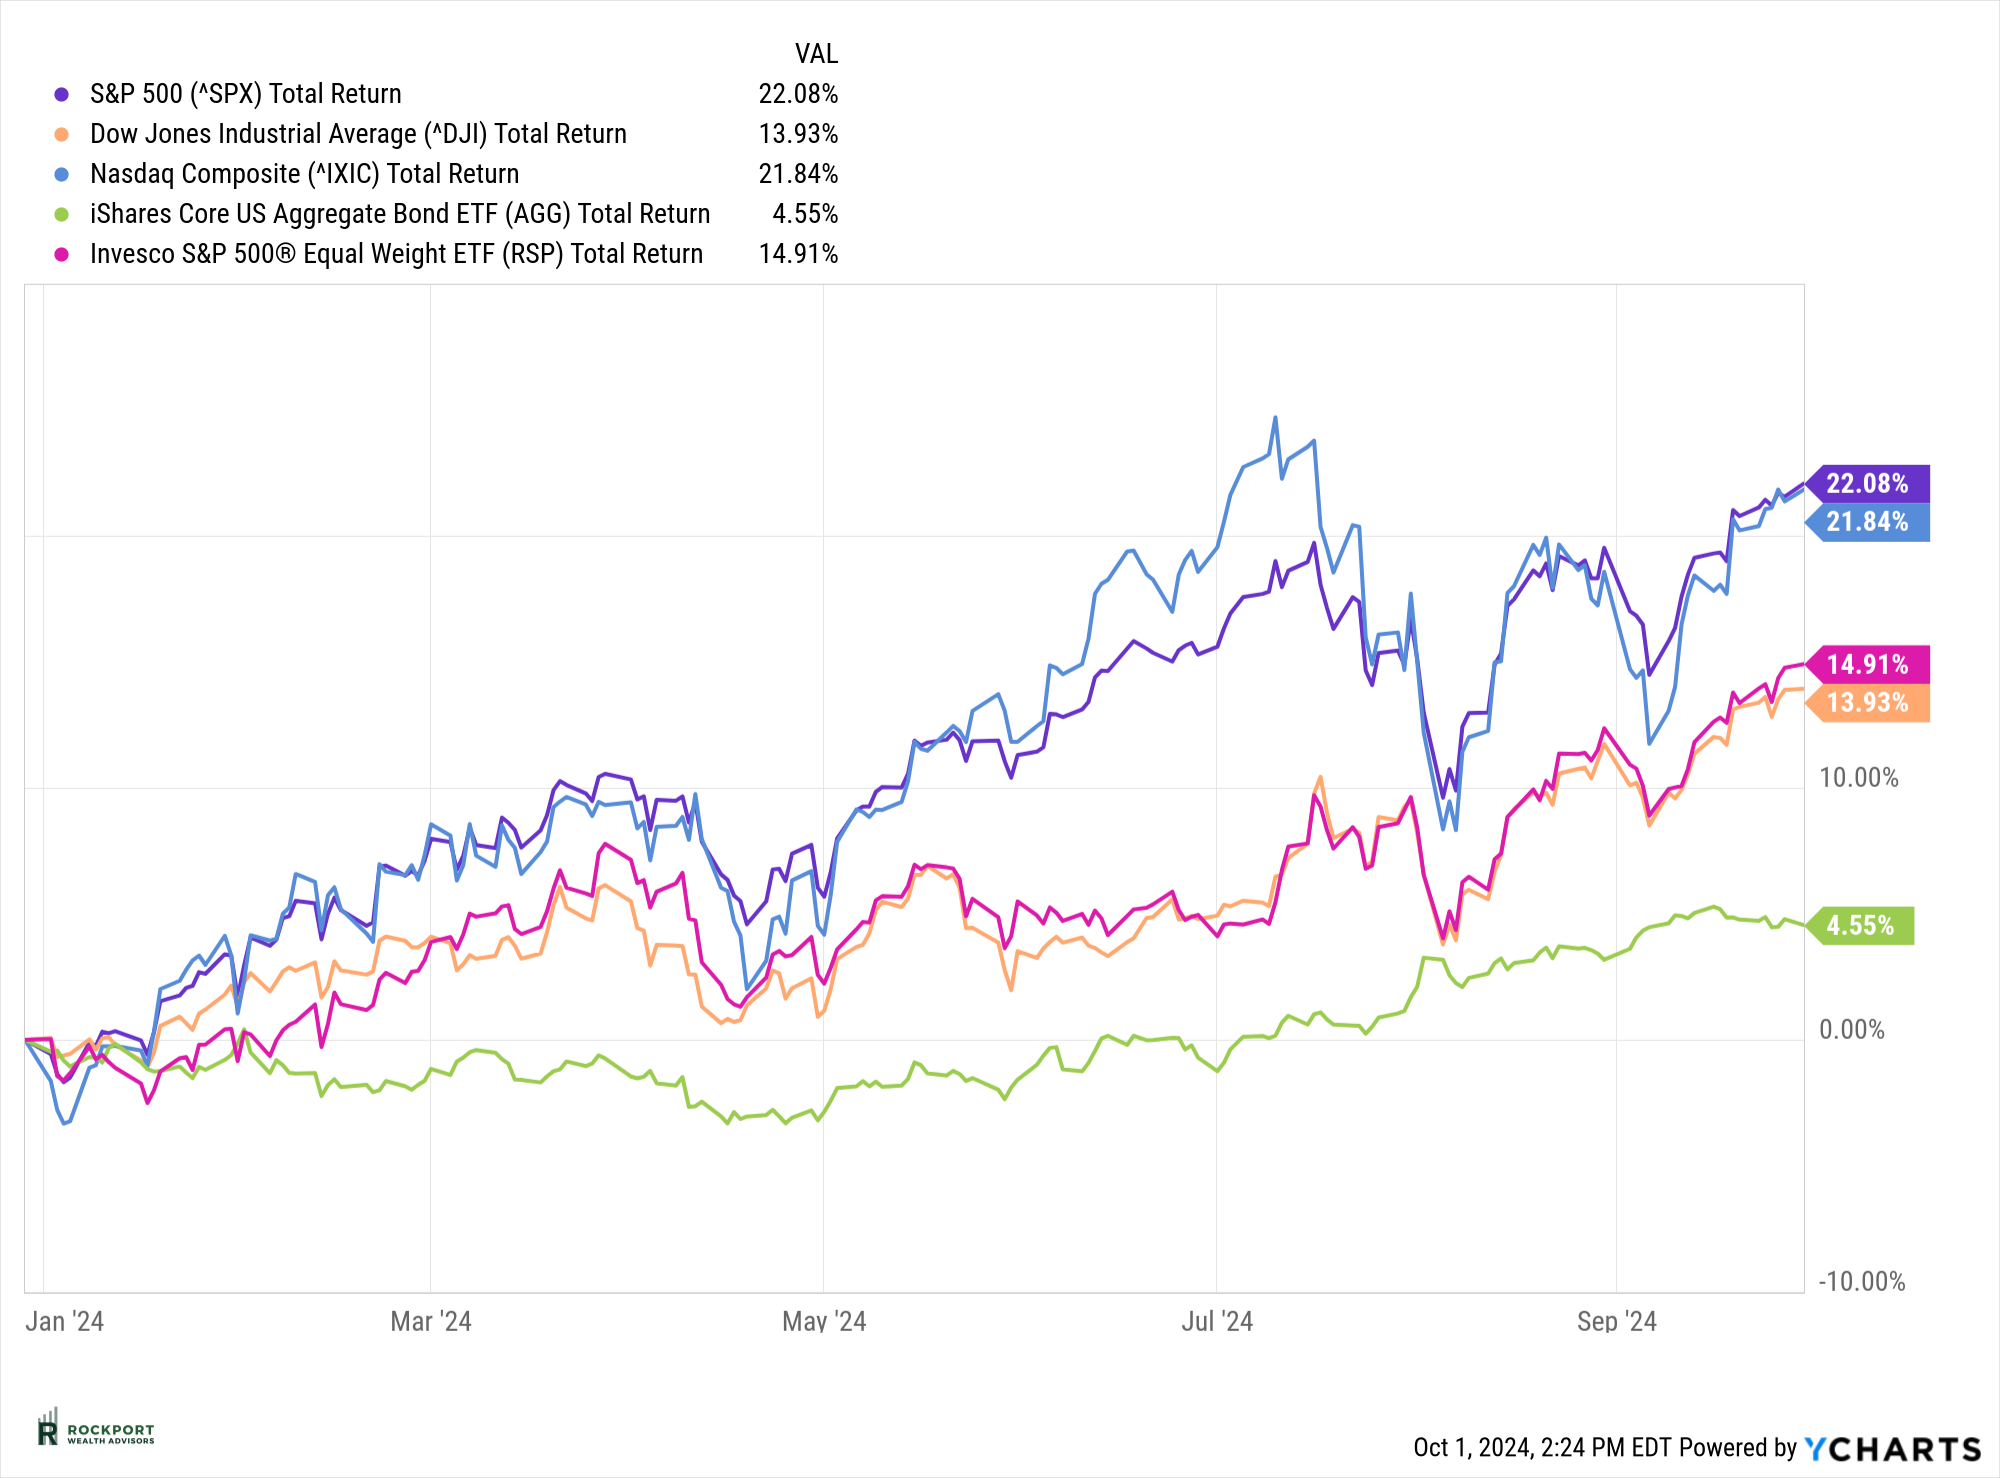
The stock market’s impressive run continues in 2024, with September—typically a more volatile month—delivering a solid return of 2.14%. This brings the year-to-date gain for the index to an impressive 22.08%. Such performance is remarkable, especially given the various challenges: geopolitical tensions, domestic political uncertainty, fluctuating interest rates, inflation discrepancies, ongoing military conflicts, and now the potential impact of the East Coast port strike, hurricane Helene and hurricane Milton on supply chains. So far, none of these factors seem to have rattled the market, but we’ll see if anything shifts as we move into the fourth quarter.

The spotlight last month was on the Federal Reserve, which made a surprising move by cutting interest rates by 0.50% on September 18th. While a rate cut was expected, the size of the reduction caught many off guard. What added to the confusion was Chairman Powell’s optimistic tone, highlighting a strong economy and a robust labor market. Our take is simple: if the economy were truly as strong as suggested, such a significant rate cut likely wouldn’t have been necessary. Much of the stock market’s recent strength has been driven by hopes for a “soft landing”—avoiding a recession. However, whether we enter a recession remains uncertain, though several indicators are pointing in that direction.
Let’s analyze a little closer some trends that we find are contrary to the chairman’s stance on the economy and labor markets. Keep in mind these are trends and can change, sometimes rapidly.
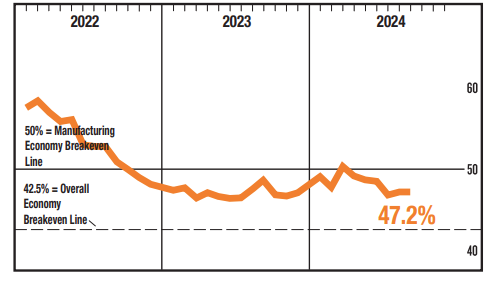
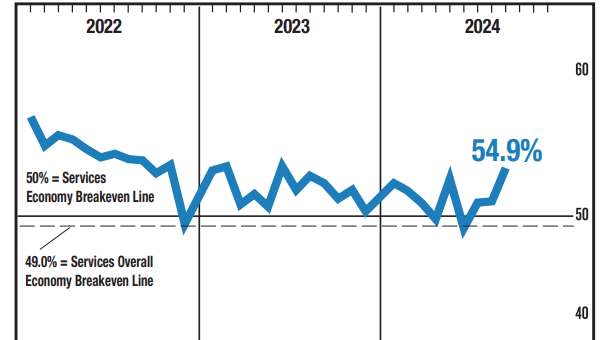
PMI Manufacturing and Services Index: Readings above 50 indicate expansion, while those below 50 signal contraction. The latest data shows manufacturing at 47.2%, firmly in contraction territory, where it has been since late 2022—a prolonged period. Meanwhile, the services sector is at 54.9%, reflecting expansion. However, as shown in the chart, services briefly dipped below 50% just a few months ago. The silver lining here is that our economy is heavily weighted toward services, accounting for 75-80%, so overall, we’re not in too bad of shape for now.
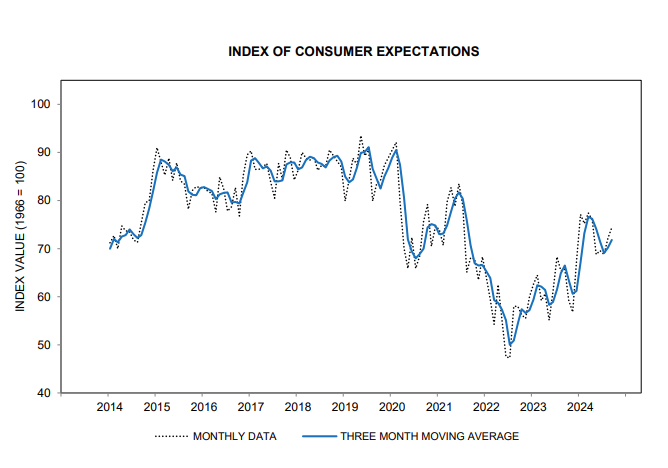
Consumer Confidence and Future Expectations: As shown in the chart, consumer sentiment took a sharp downturn in September. The concern here is that for economic growth to continue, consumers need to feel confident and maintain or increase their spending. This metric is worth monitoring closely as we head into the fourth quarter, as further declines could signal a potential recession. Interestingly, while current sentiment has weakened, future expectations remain more resilient, indicating that consumers feel more optimistic about the future than their present circumstances. We’ll have to keep an eye on whether this trend persists. 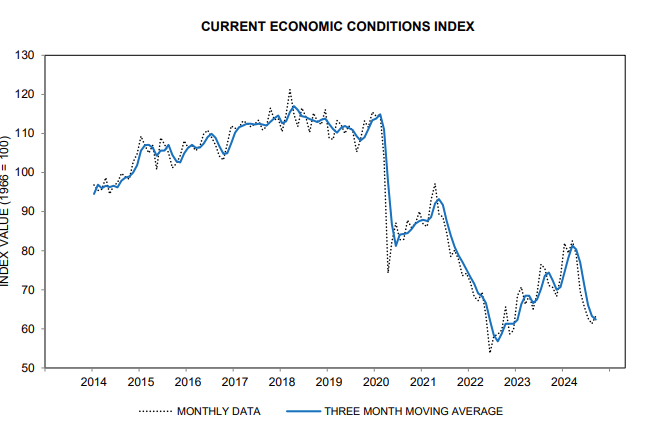
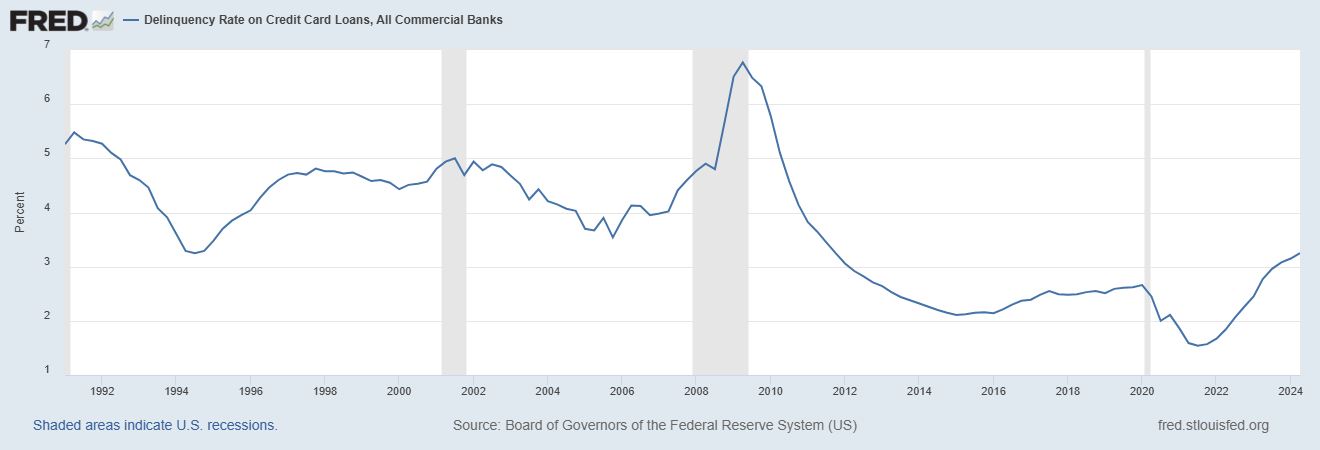
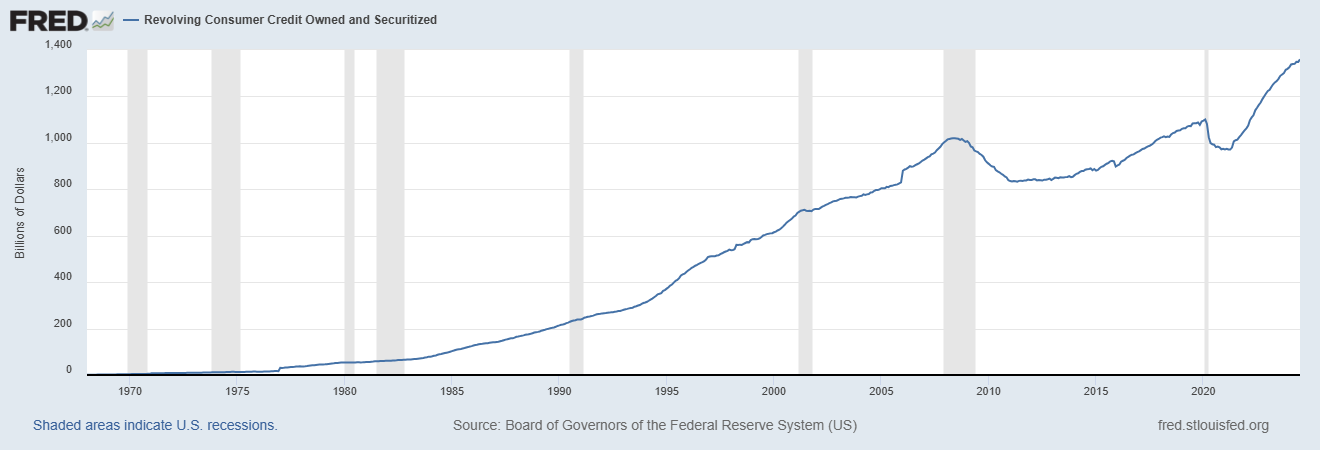
Consumer Credit: The health of the consumer is a critical factor when assessing the likelihood of a recession. Right now, there are signs of increasing stress, as the next two charts illustrate. Credit card delinquencies are on the rise, and revolving consumer credit continues to grow. This suggests that many people are relying on credit cards to cover everyday expenses. These patterns are similar to those observed before previous recessions.
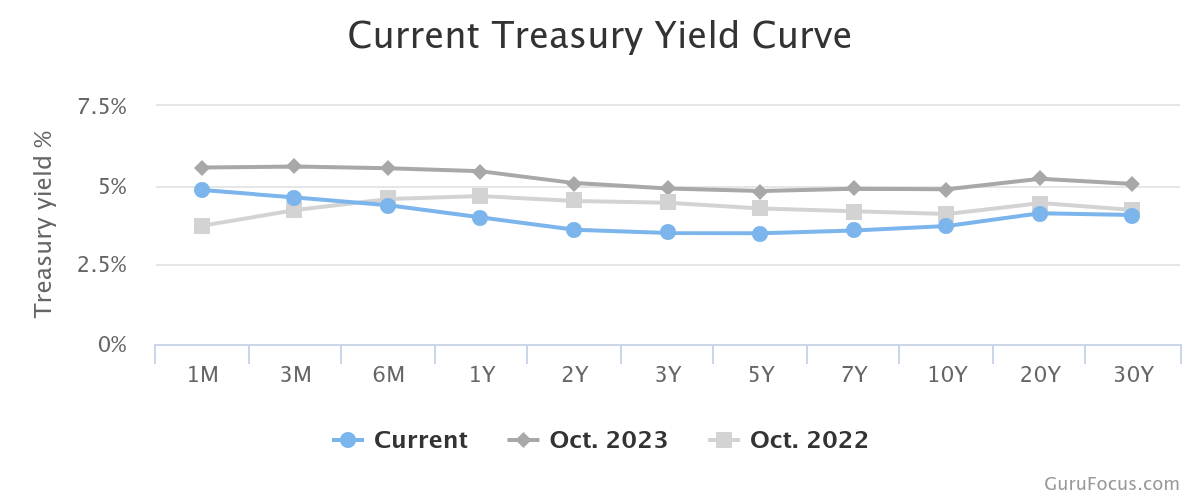
Yield Curve: After more than two years of inversion—where short-term rates were higher than long-term rates—the yield curve briefly uninverted last month, ending one of the longest periods of inversion in history. The yield curve has been one of the most reliable recession indicators over the past 50 years. However, it’s important to note that there is often a significant lag between the inversion and the onset of a recession, and we are currently in that window. Interestingly, as of this writing, the curve has slightly re-inverted again. These are truly extraordinary times, and we will need to closely monitor this indicator moving forward.
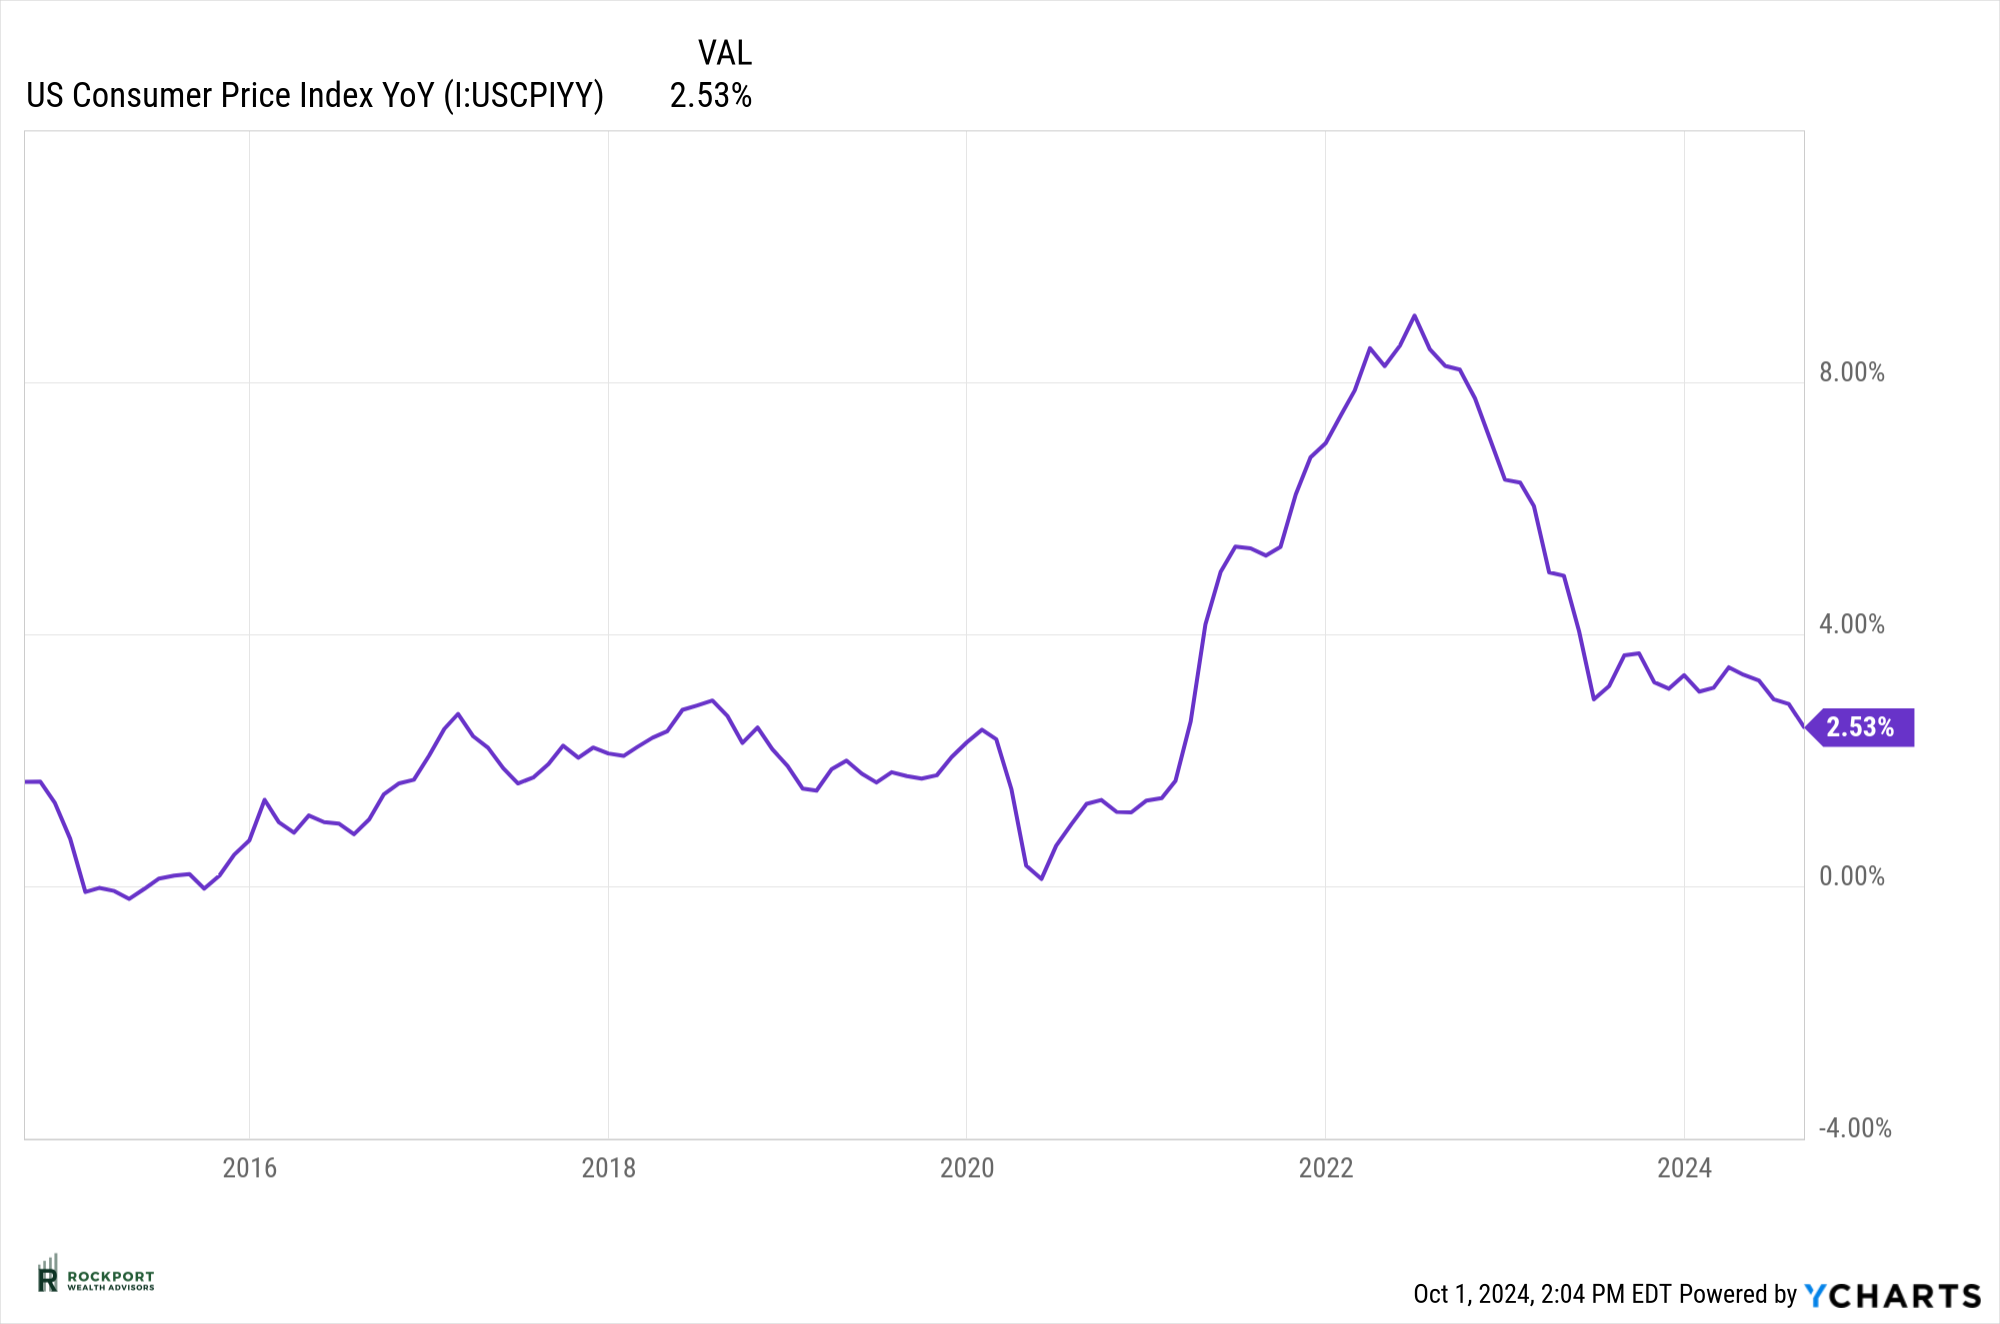
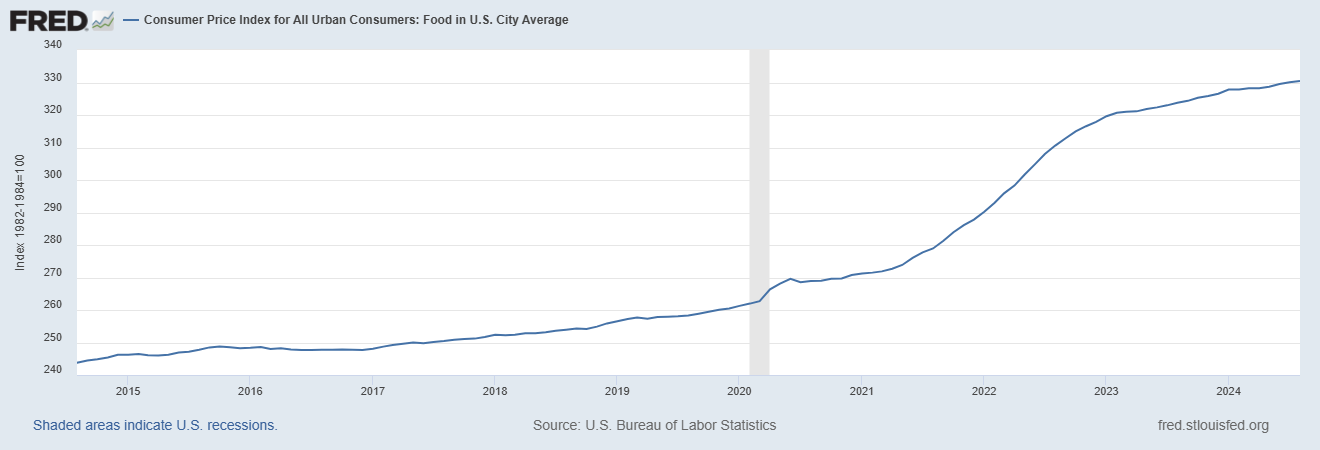
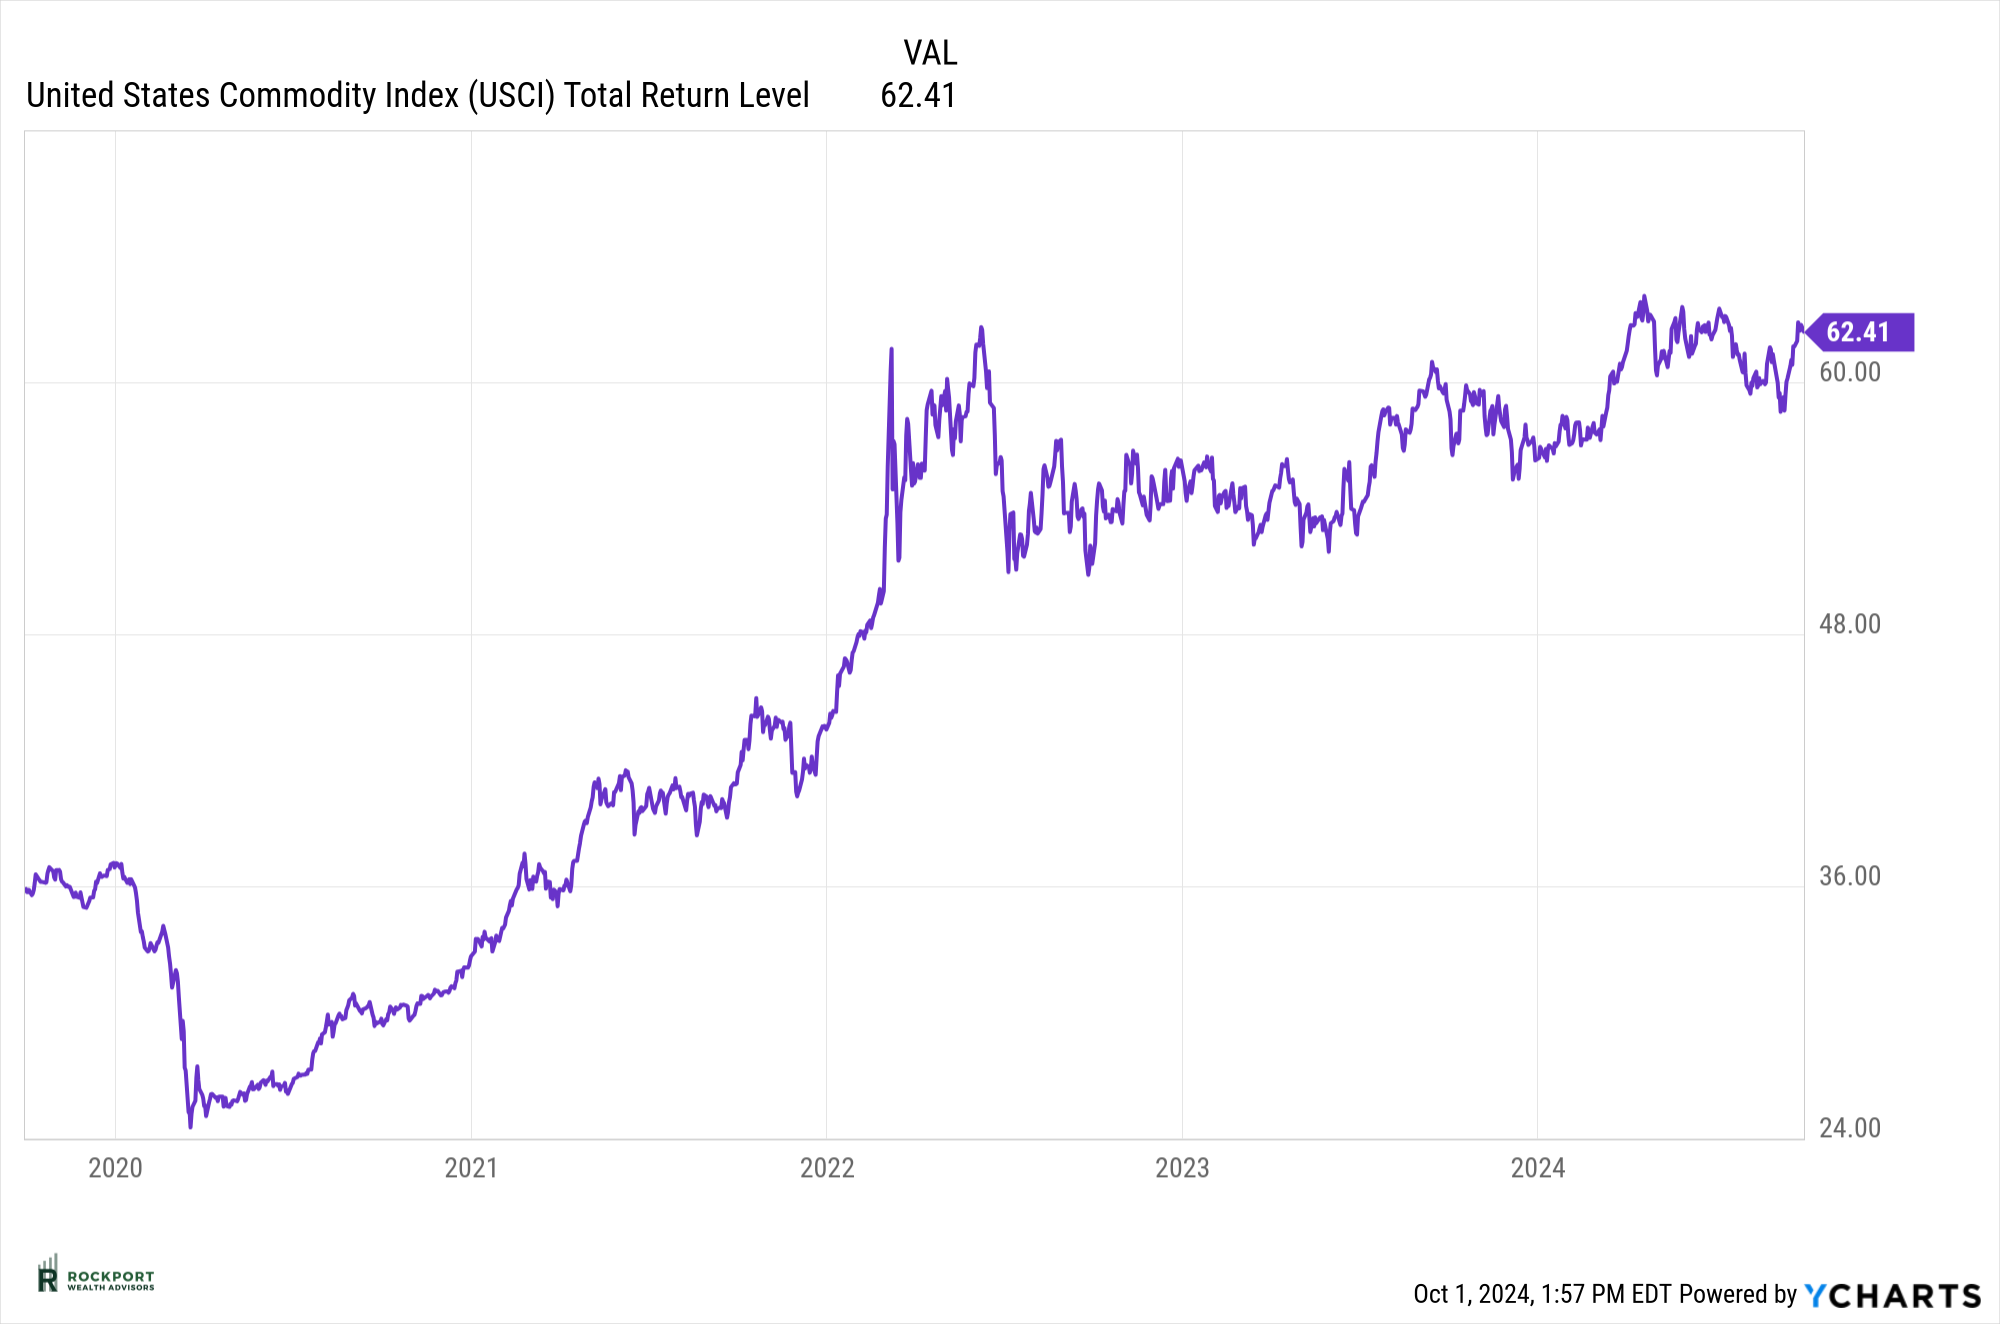
Commodities and Inflation: Over the past couple of years, we have devoted significant attention to inflation. The Consumer Price Index (CPI), which once exceeded 8%, has now decreased to 2.53%. While the Federal Reserve is not celebrating just yet, they have largely signaled that inflation is under control. However, the benefits for consumers have been limited. The updated chart on food prices below illustrates this point. Additionally, commodity prices have climbed back up toward their previous highs. This highlights the disconnect between government-reported inflation figures and the real impact we experience through essential items like food and energy.
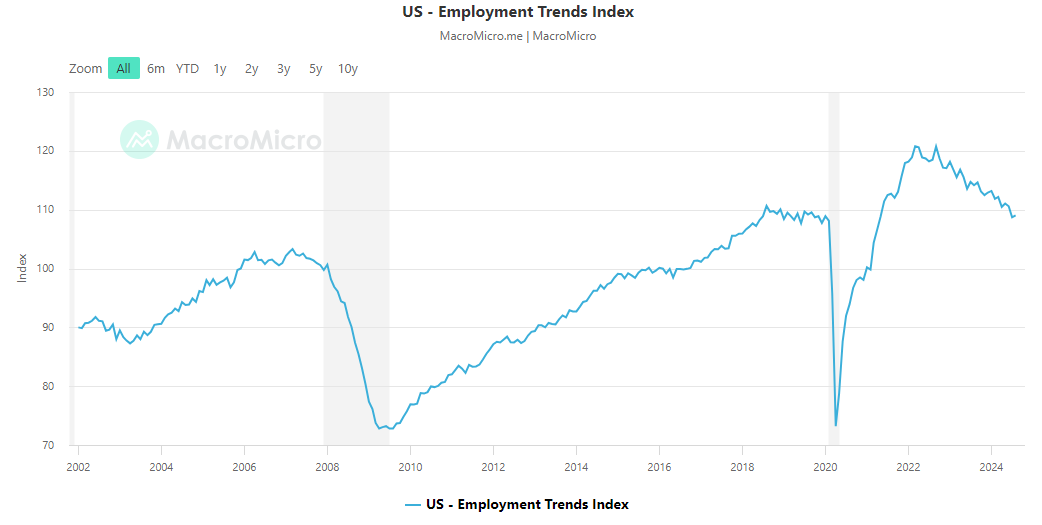
Employment: We believe the Federal Reserve is closely monitoring employment trends, which likely influenced their decision to cut interest rates by 0.50% this past month. The chart below illustrates the Employment Trends Index, which has been steadily declining since 2022. This index is a composite of eight leading labor market indicators and reflects patterns that have historically been associated with recessions.
We are not advocating for a recession to occur, and as mentioned earlier, the question of whether one will happen remains unresolved. Our perspective is that the current situation seems inconsistent. Given how quickly circumstances can change these days, we will continue to keep you informed. Perhaps, just perhaps, the Federal Reserve will successfully navigate this situation and achieve a soft landing for our economy—avoiding a recession altogether.
Tax Talk
Tax Loss Harvesting
With the onset of the 4th Quarter we will begin to look at Tax loss selling in non IRA accounts as a possible tax saving strategy. A few key bullet points on the process itself:
- Tax-loss harvesting involves selling an investment at a loss in order to offset the taxes resulting from a capital gain.
- Typically, the asset sold at a loss is replaced with a similar investment after a certain timeframe.
- When capital losses are greater than capital gains, investors can deduct up to $3,000 ($1,500 if married filing separately) from their taxable income.
- If net losses for a certain year exceed $3,000, the balance can be carried over and deducted on future returns.
Please keep in mind that any gains or losses are reported on form 1099 DIV at year end for tax reporting purposes.
Rockport News
We continue to grow!!! The past couple of months have seen several new hires at both our Cleveland and Youngstown offices.
Sierra Ryzner recently joined our Youngstown office and will be working initially as a client service associate. She graduated from Youngstown State University, where she completed her degree in December 2021. She recently relocated from Arlington Virginia where she worked in various administrative roles for an accounting firm. When asked about her new position she states, “I am thrilled to be back in my home state and I am grateful for the opportunity to work with such a dedicated team to help clients achieve their financial needs and goals. I look forward to making a positive impact in their financial journeys.”
Tom David has joined the Cleveland office and will be working with clients and on special projects. He is a licensed CPA, a CFP® Professional and holds a Series 65 license as an Investment Advisor Representative. He received a BA from Kent State University and an MBA from Cleveland State University. Tom spent over 10 years in public accounting preparing audits and taxes for small business owners. He also has over 15 years of experience in the wealth management industry in various roles as a client service director, investment advisor, chief compliance officer and chief financial officer with various firms.
Thomas Bell, a recent graduate of Bowling Green State University, has joined the Cleveland office as a Paraplanner. He was born and raised just outside London, England but school and golf brought him over to the United States. An All-American golfer at his previous school in Iowa, he transferred to Bowling Green State University to complete his Bachelor’s Degree and play Division 1 Golf.
As always, if you have any questions on anything we have talked about here or anything else that is on your mind, please feel free to reach out.
*The Standard & Poor’s 500 (S&P 500) is an unmanaged group of securities considered to be representative of the stock market in general. Results can be found at slickcharts.com.
*Treasury yields can be found at finance.yahoo.com.
*Charts produced at yCharts.com
*The LEI can be found at Conference-board.org
*Bonds can be found at https://www.bloomberg.com/markets/rates-bonds
*CME FedWatch Tool – CME Group
*University of Michigan Consumer Confidence found at SentimentTrader.com
*FRED Charts produced by Federal Reserve Bank St. Louis
*PMI Manufacturing and Services Indexes, and Consumer Confidence and Future Expectations at Conference-board.org
* Rockport Models – Please remember we are referencing our model portfolios, and your portfolio may differ from the models mentioned depending on your individual needs and circumstances.