
An ugly last week in April closed out an Ugly month for the stock and bond markets. The S & P 500 for the month was down nearly 9% and for the year is down close to 13.5%. Interestingly were at this same level in early March and had a substantial rally from there so we are curious to see if the same thing happens again.
The Fed and interest rates as well as inflation continue to dominate the head lines and dictate movement of the markets. It is widely expected that the Federal Reserve will raise interest rates ½ percent in May and additional increases of perhaps ½ percent or even more or likely as we move through June and the rest of the year.
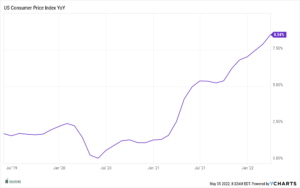
Inflation continues to move higher yet with the end of February reading being nearly a half point higher than end of January at 7.87% Year over year increase (See Consumer Price Index Chart below, we will stick with this chart until it no longer becomes a hot topic). It would be very surprising if the next reading for March showed improvement You have to go back to the early 1980’s to find Consumer Price Index readings as high as they are now.
The chart below shows that the CPI (Consumer Price Index) has again hit a new high year over year going from 7.87% in March to 8.54% in April. The 1 million dollar question is when will this number stop going up, begin to level off and eventually drop. The Federal Reserves main tool for getting that under control is raising interest rates to slow things down which is exactly what they are trying to do. For now however, the CPI continues it’s ascent.
It is important to note that when inflation starts to decline it is highly unlikely to go back to the 2% level we enjoyed for so many years. The reason for this is wages across the board are substantially higher and those wages are not likely to decline. However, other inflation type forces will eventually subside like supply demand and the supply chain issues that have also contributed to the high CPI readings. Perhaps something in the 5% range becomes the new normal for inflation going forward? Only time will tell……

Most investors know that stocks are volatile securities that can experience 10% drops at any time, a lot of times without notice or seemingly logical reasons. Bonds however are generally considered less volatile investments and don’t generally experience as quick moves up or down. This has not been the case this year. One thing that we have found very surprising is the rapidness of the decline in the bond market. At the beginning of the year it was widely anticipated that interest rates would move up somewhat and that would put downward pressure on bonds. What no one expected was the swiftness at which this has happened. For example the 10 year Treasury yield at the beginning or the year was yielding close to 1.6% it has recently hit 3%. This is an incredible move higher in just 4 months and has caused bond investments to decline in value substantially. Why? Bond prices fall when yields rise it’s a simple as that. This has caused Bond funds to have losses through the first 4 months of the year many of which have been double digits. The unfortunate part is that this has hurt the conservative investor who has a balanced portfolio or even a bond heavy portfolio the most and returns have not been as substantially different between more aggressive investors and conservative ones. As we had eluded to in previous newsletters we did make changes to models in anticipation of higher interest rates by adding what are called alternative investments which have helped but unfortunately portfolio declines are still very noticeable across the board.
Things are likely to stay volatile for some time yet. In general, the markets hate uncertainty and there is a ton of it right now. As we move through the year and there is more clarity from the Fed on interest rates and inflation a large amount of the uncertainty will be removed and should help towards stabilizing things.
As always if you would like more detail or have questions please reach out. Happy Spring!
*The Standard & Poor’s 500 (S&P 500) is an unmanaged group of securities considered to be representative of the stock market in general. Results can be found at slickcharts.com.
*Treasury yields can be found at finance.yahoo.com.
*Charts produced at yCharts.com