Hope you are enjoying the final days of summer as fall is coming! On some days it feels like it’s already here. Time to root for your favorite NFL team!
Markets & Economy
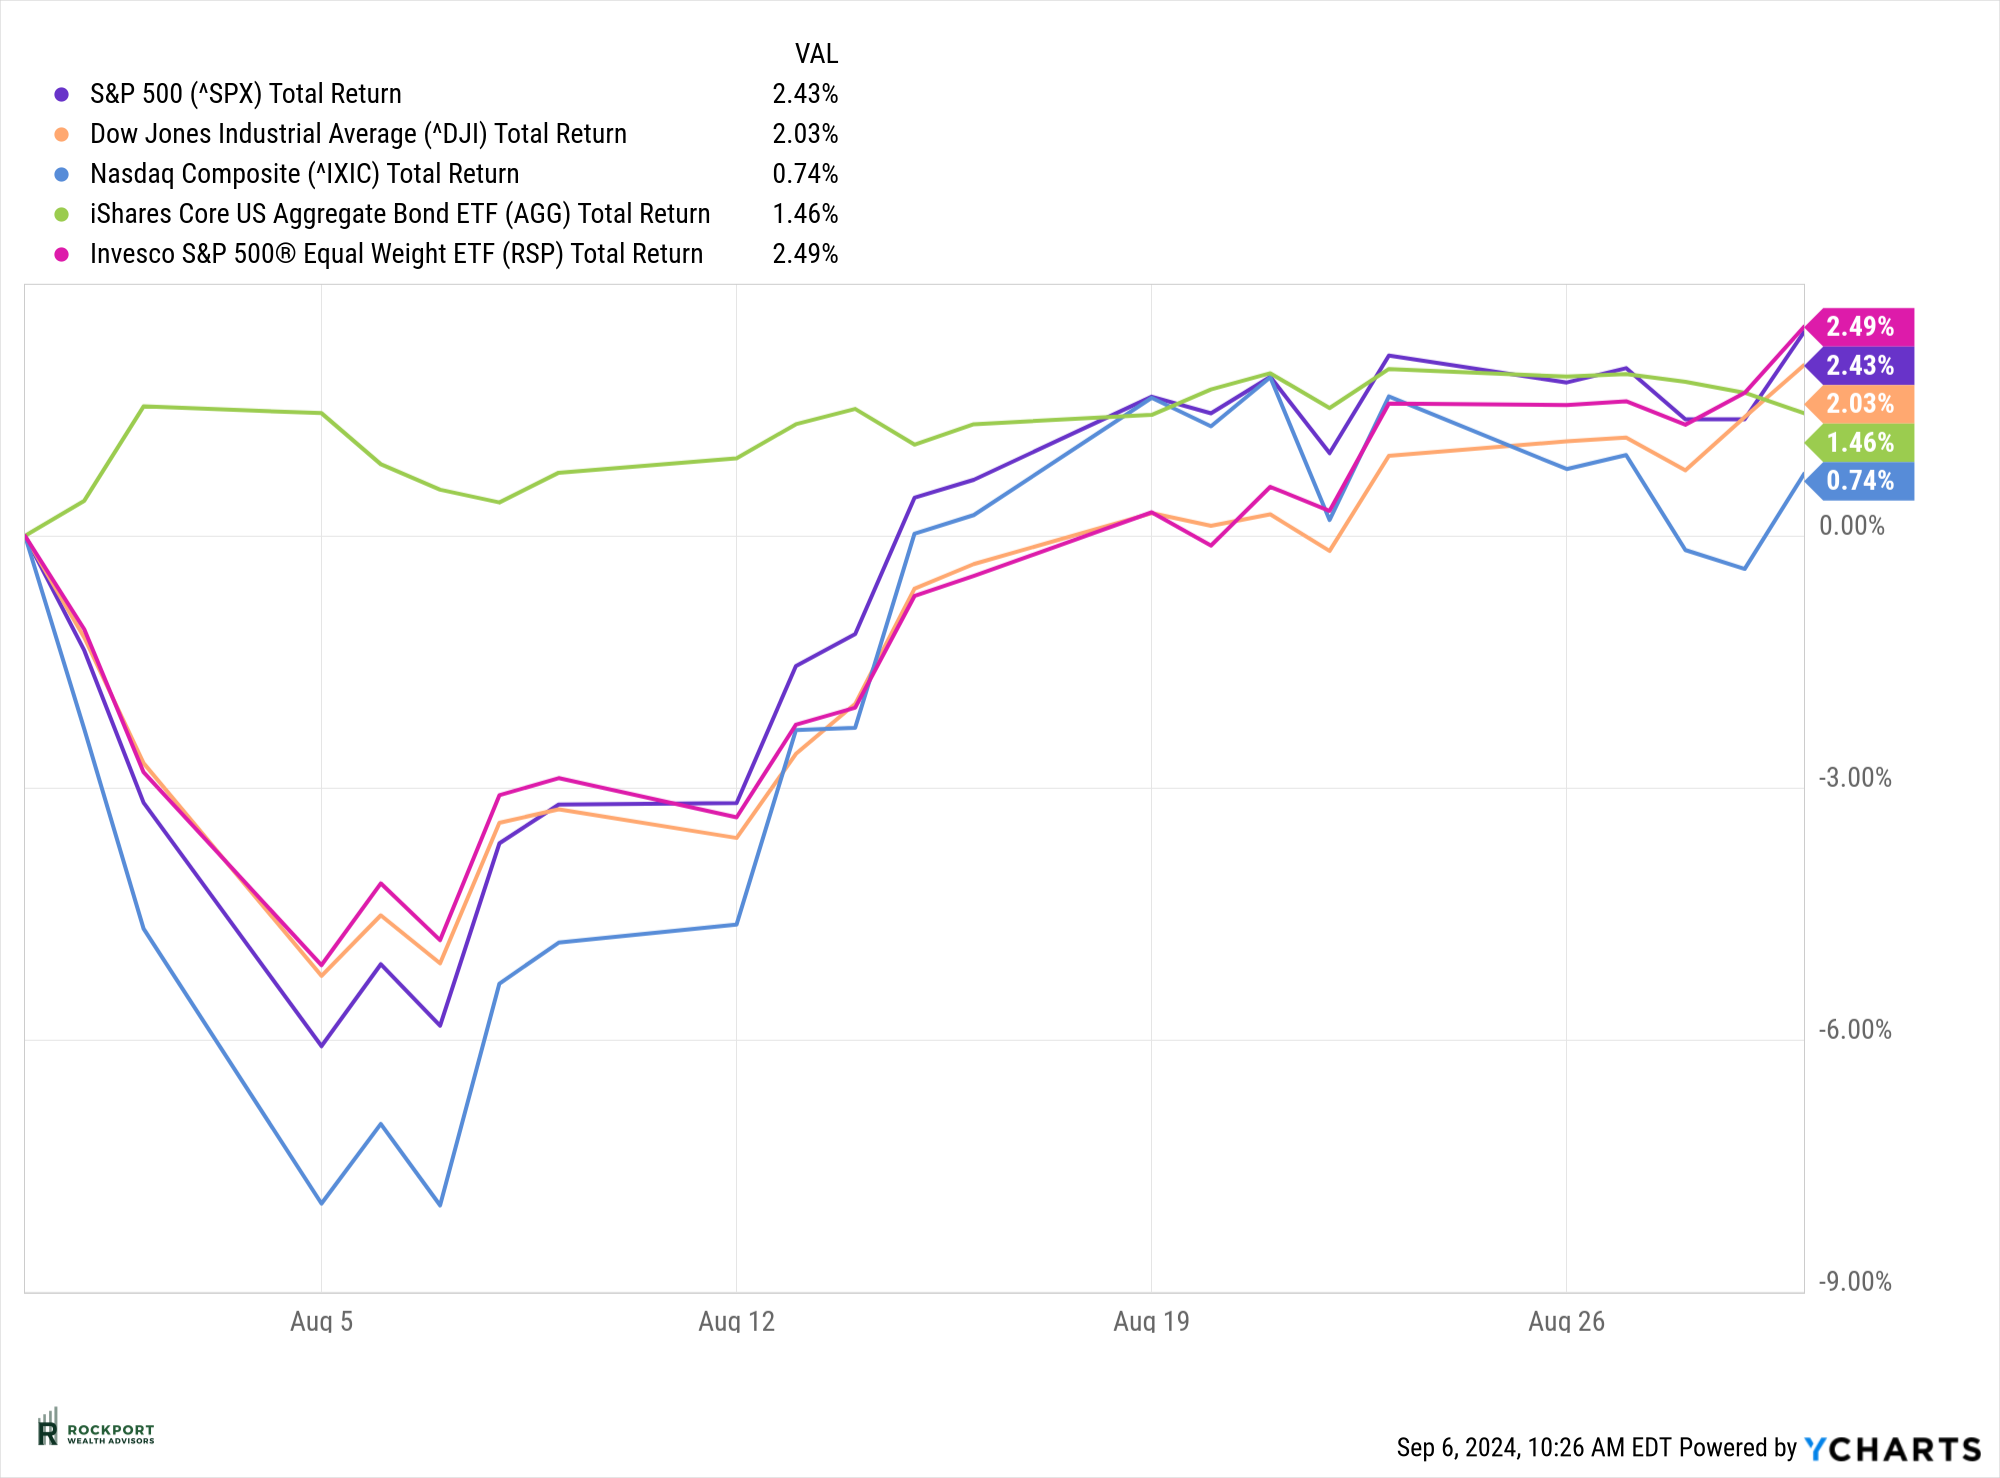
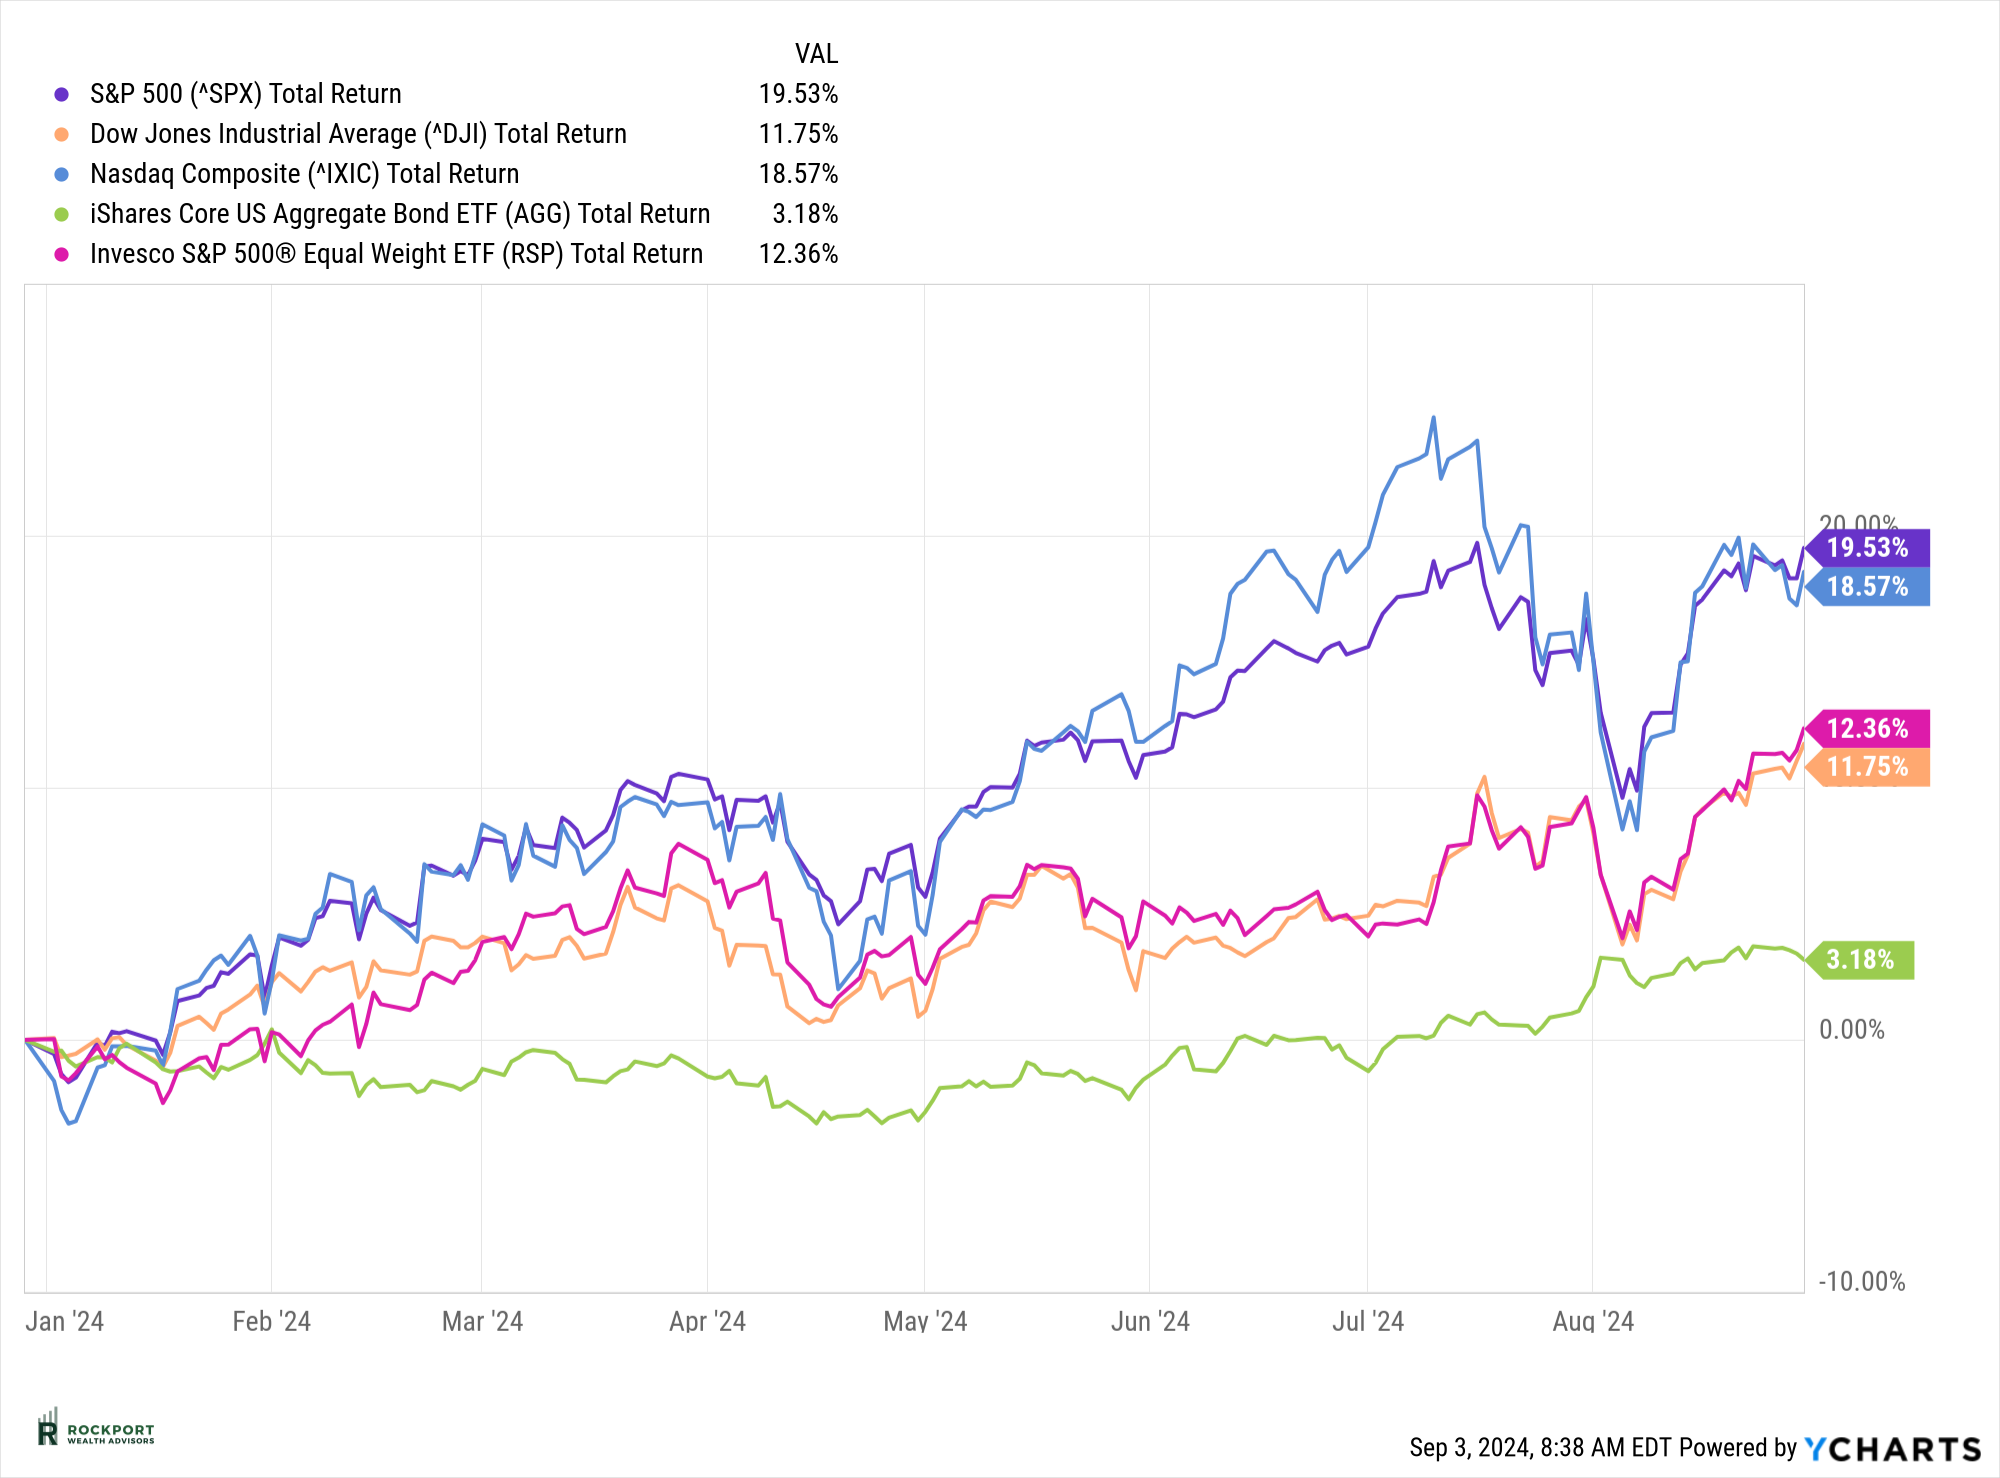
August was certainly an eventful month. It began with significant volatility, as the first few days saw a sharp but brief drop in the S&P 500 index. At its lowest point, the index had fallen over 8.5%. However, a swift recovery—similar to those we’ve seen recently—brought the index back into positive territory. By the end of August, the S&P 500 had gained 2.43%, bringing its year-to-date return to an impressive 19.53%. Investor sentiment remains strong, with a prevailing belief that any declines in stock prices will be quickly reversed. While this mindset will inevitably shift at some point, it currently continues to dominate the market outlook.
Meanwhile, the S&P 500 Equal Weight Index has outperformed the traditional market-cap-weighted version over the past few months. In August, it led the pack, delivering a 2.49% return and bringing its year-to-date performance to 12.36%. This shift indicates that the market is becoming less dependent on a few large-cap names—a positive development for broader market participation.
Historically, August tends to be a negative month for the market, but this year defied that trend. Now, all eyes are on September, a month known for its own share of unpredictability.
As we mentioned previously, we’re stepping away from discussing CPI and Sticky CPI for now, as the government views inflation as being on the path to control. However, the following chart is particularly relevant because it impacts all of us directly. The cost of food has shown no signs of decreasing—in fact, it’s been steadily rising since the onset of the COVID-19 pandemic in March 2020. This highlights a key reason why, despite the government’s assertion that inflation is easing, many consumers aren’t feeling the relief. 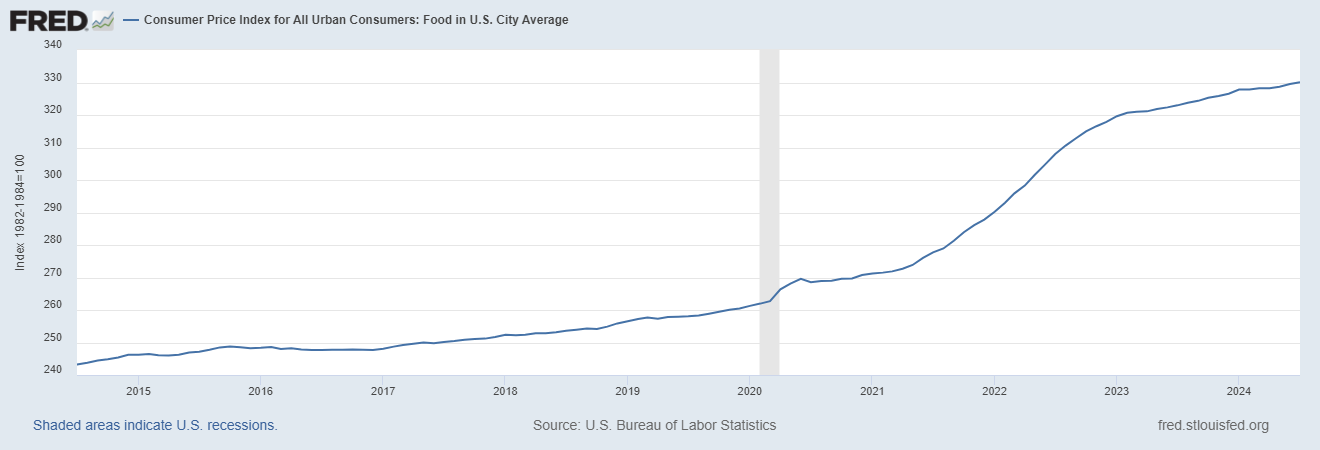
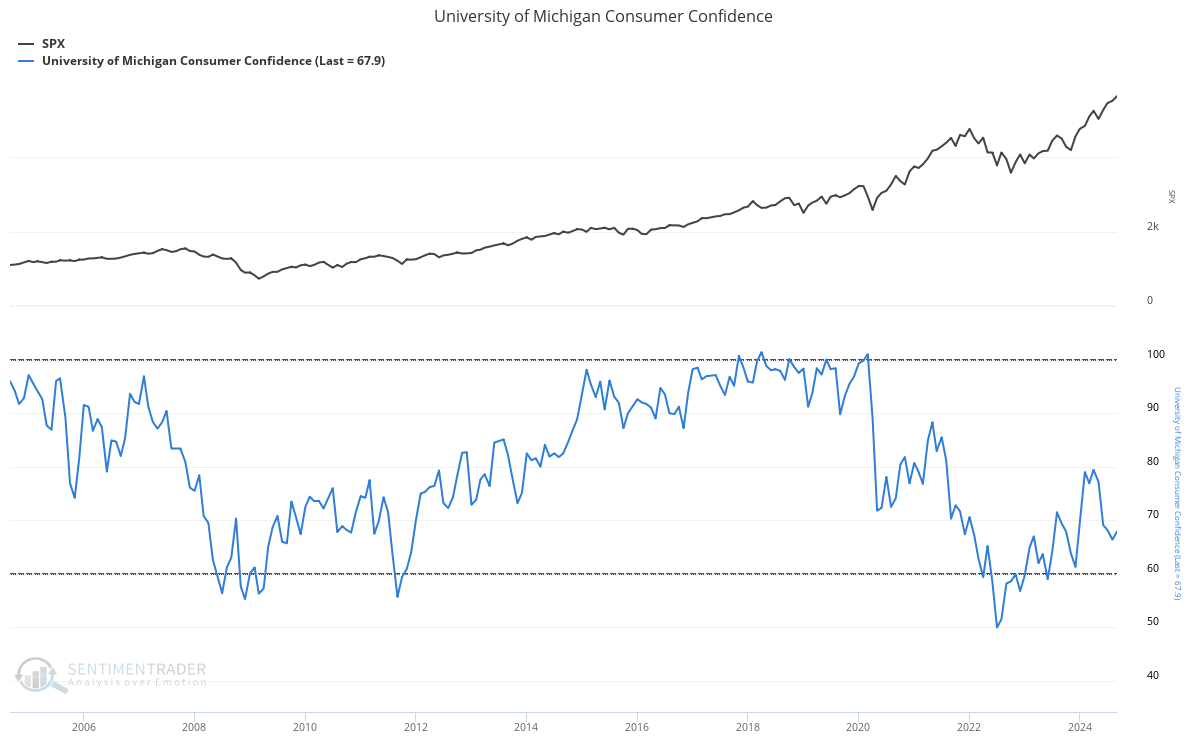
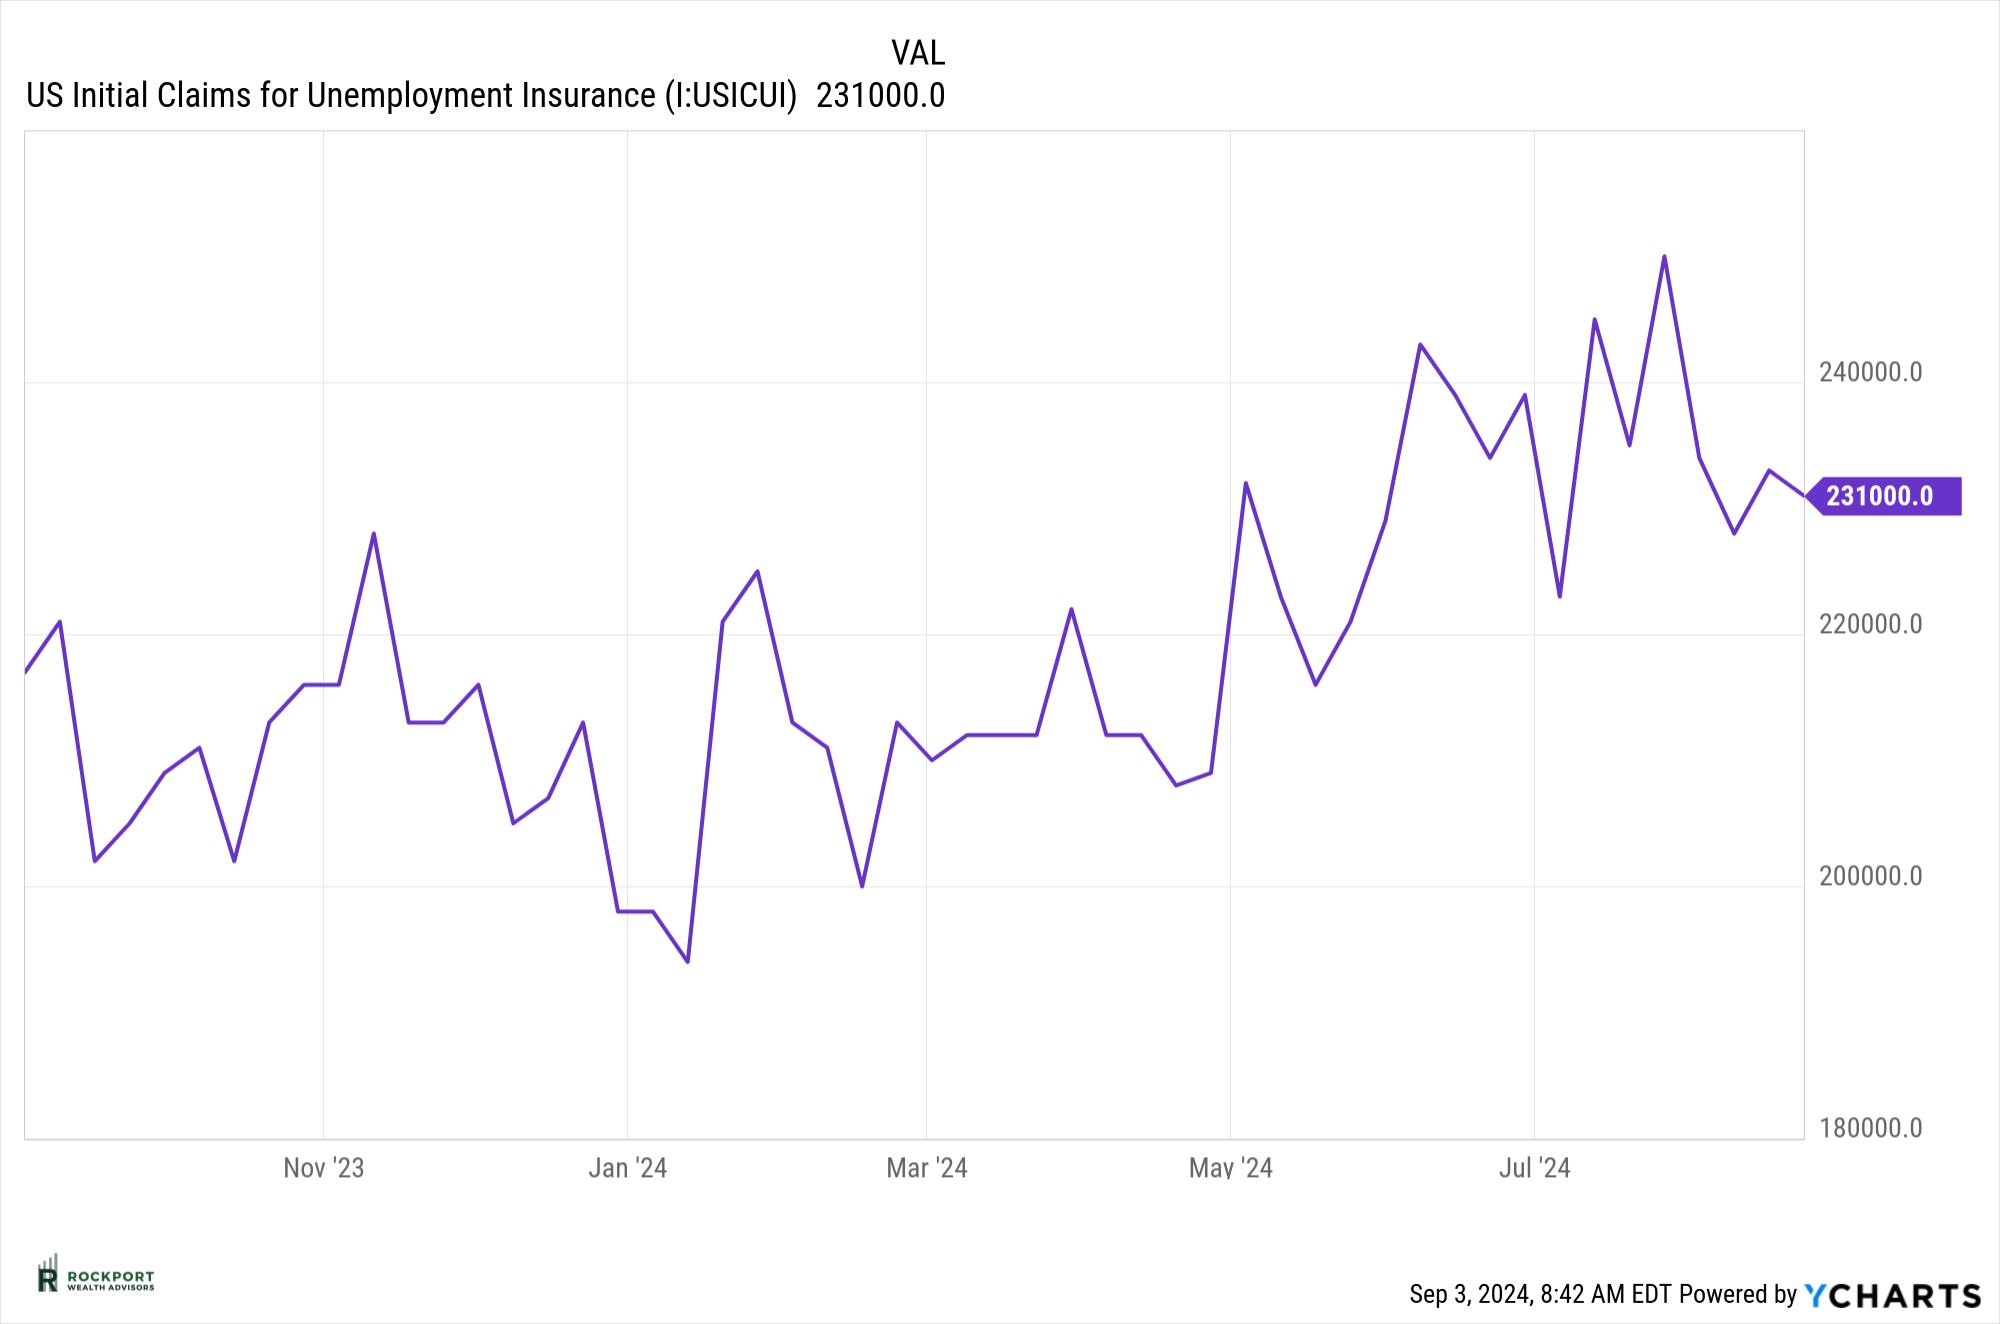
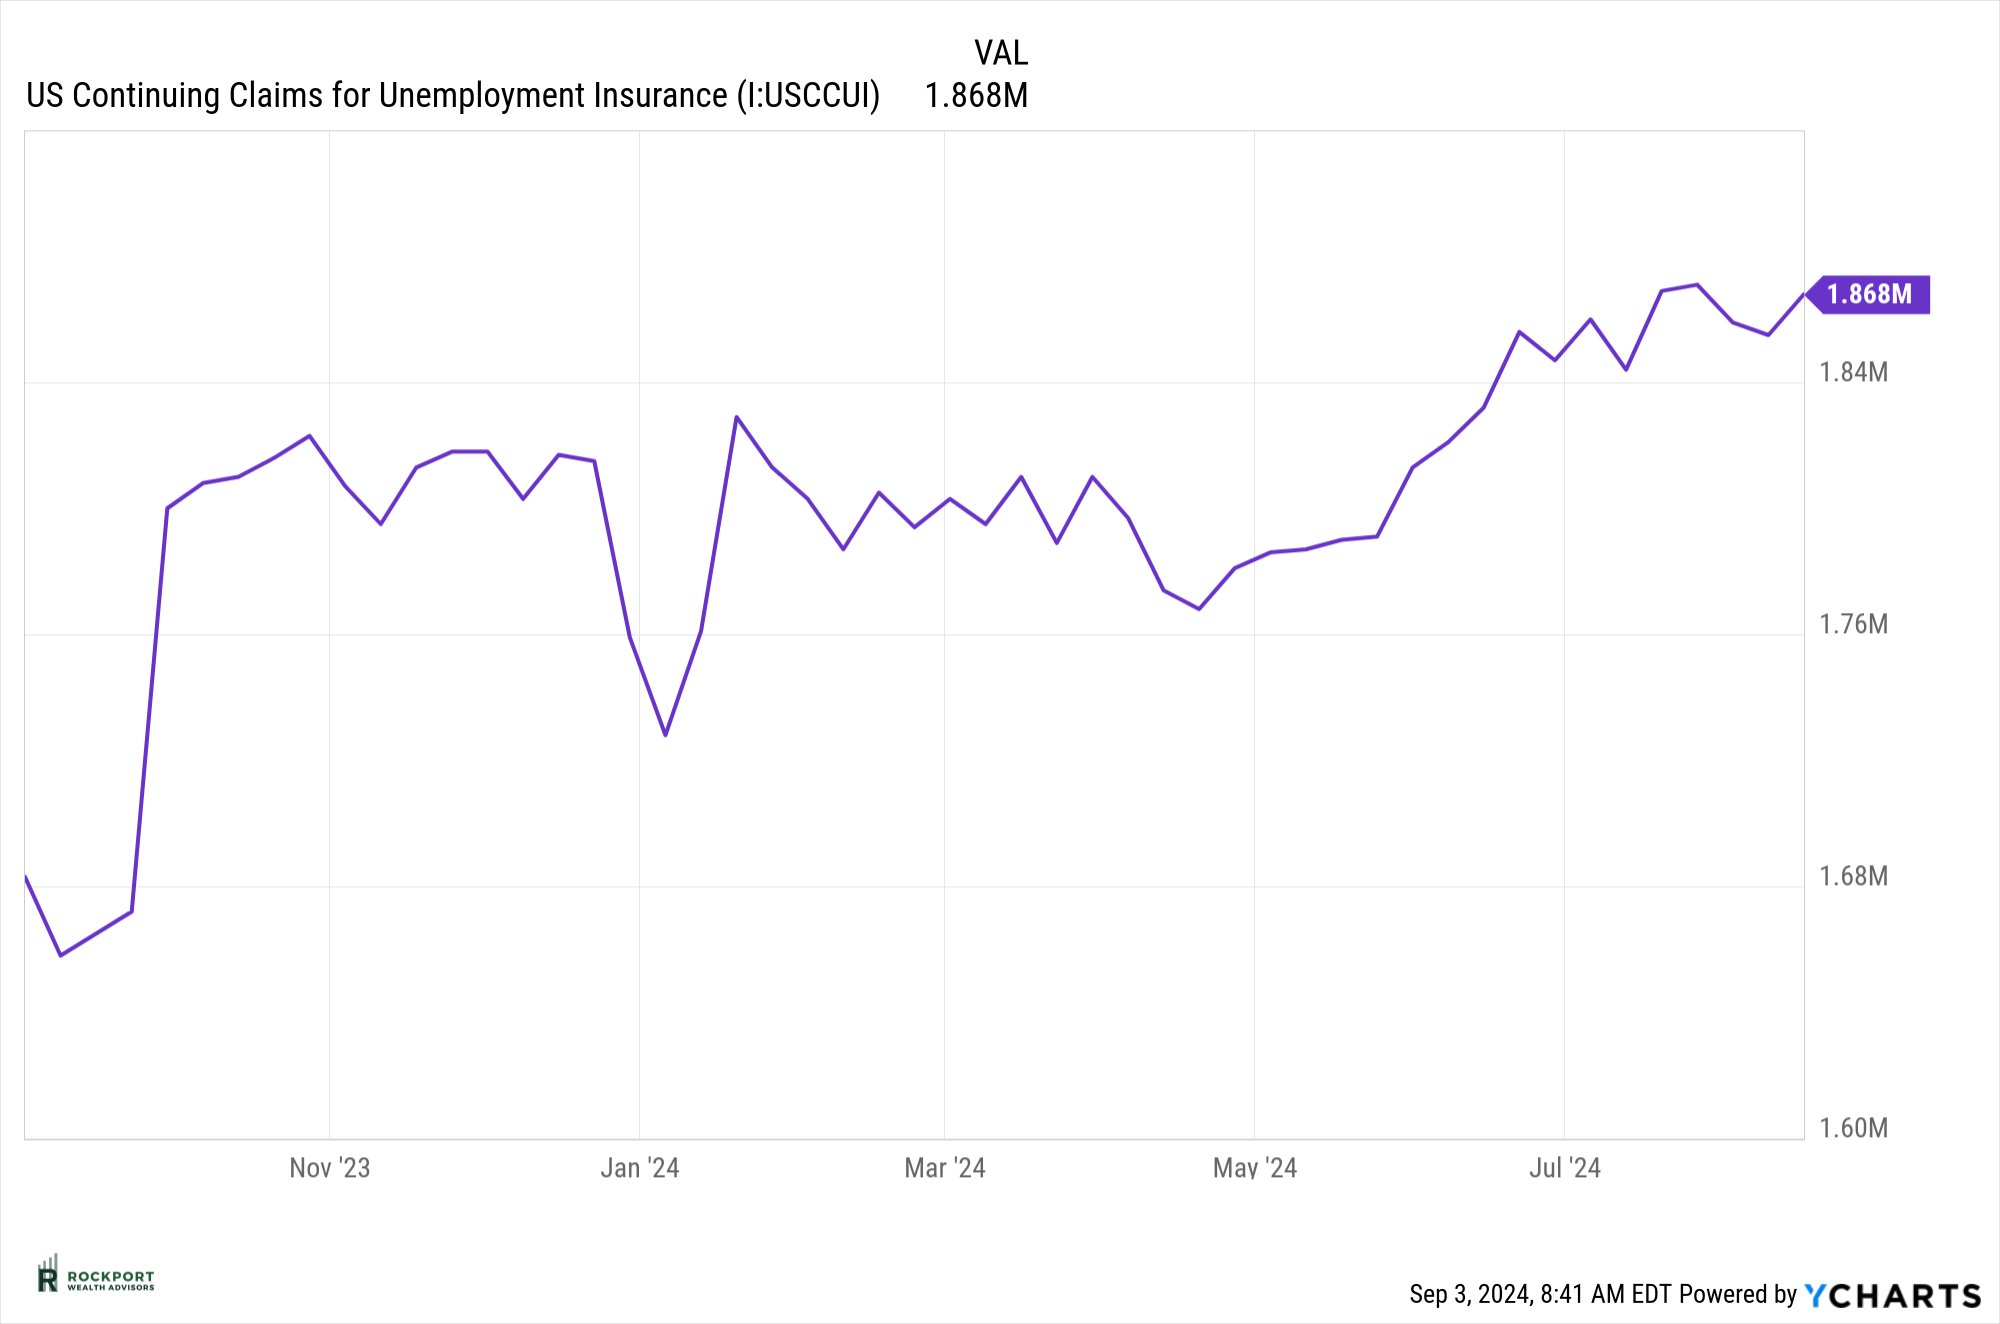
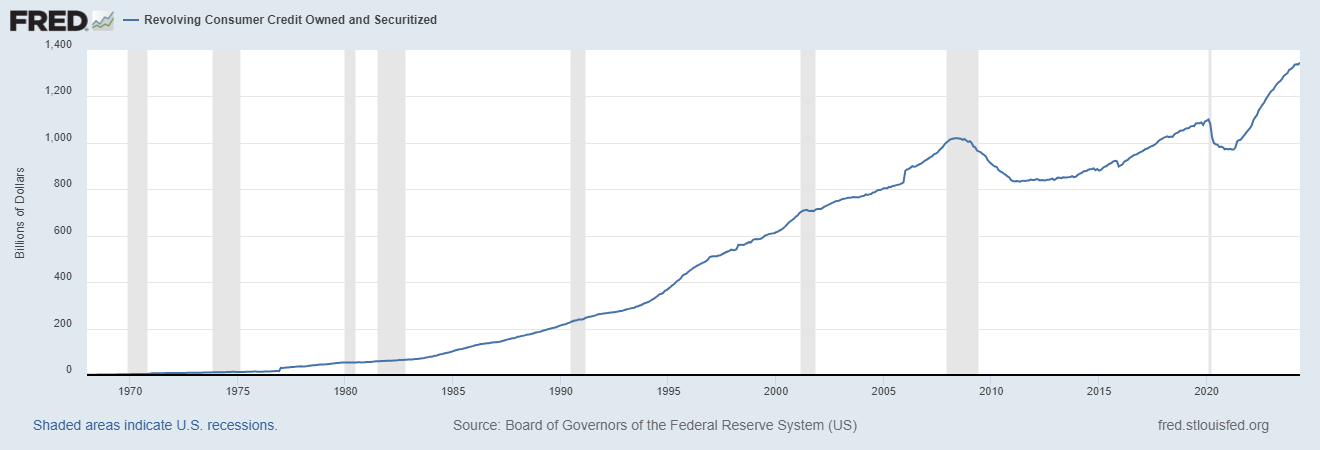
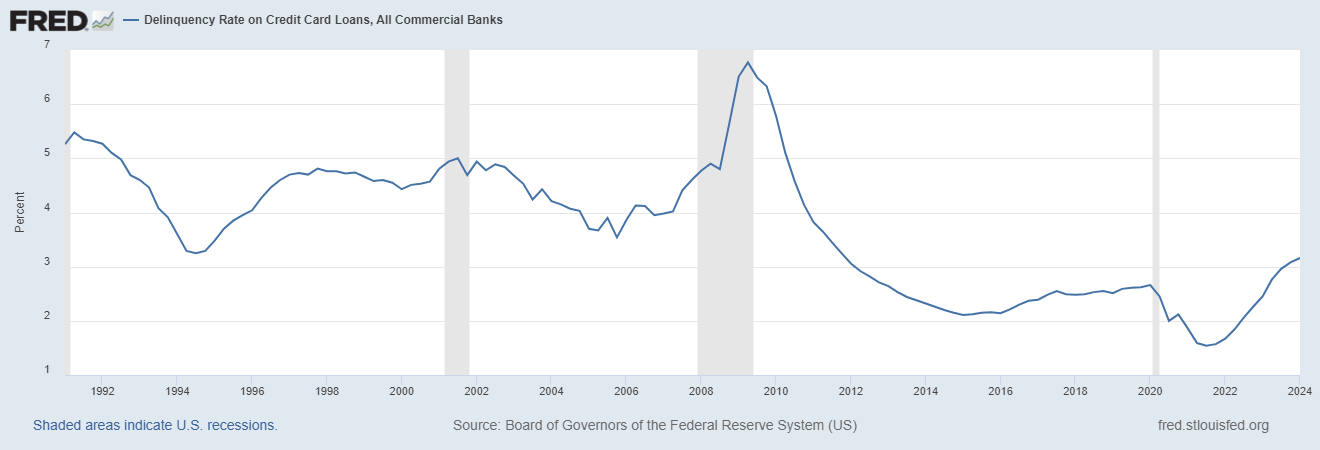
A quick update on inflation and economic data shows that conditions have not improved. The New York Fed’s Recession Probability Model edged up slightly to 56.29%. While the University of Michigan Consumer Confidence reading showed a very modest increase, it remains near its lowest level for the year. Particularly concerning is the ongoing weakness in employment data—initial claims for unemployment have decreased slightly, but continuing claims have risen. Additionally, consumer stress is becoming more evident as both the total amount of credit owed and, perhaps more significantly, the delinquency rate on credit card loans continue to climb. 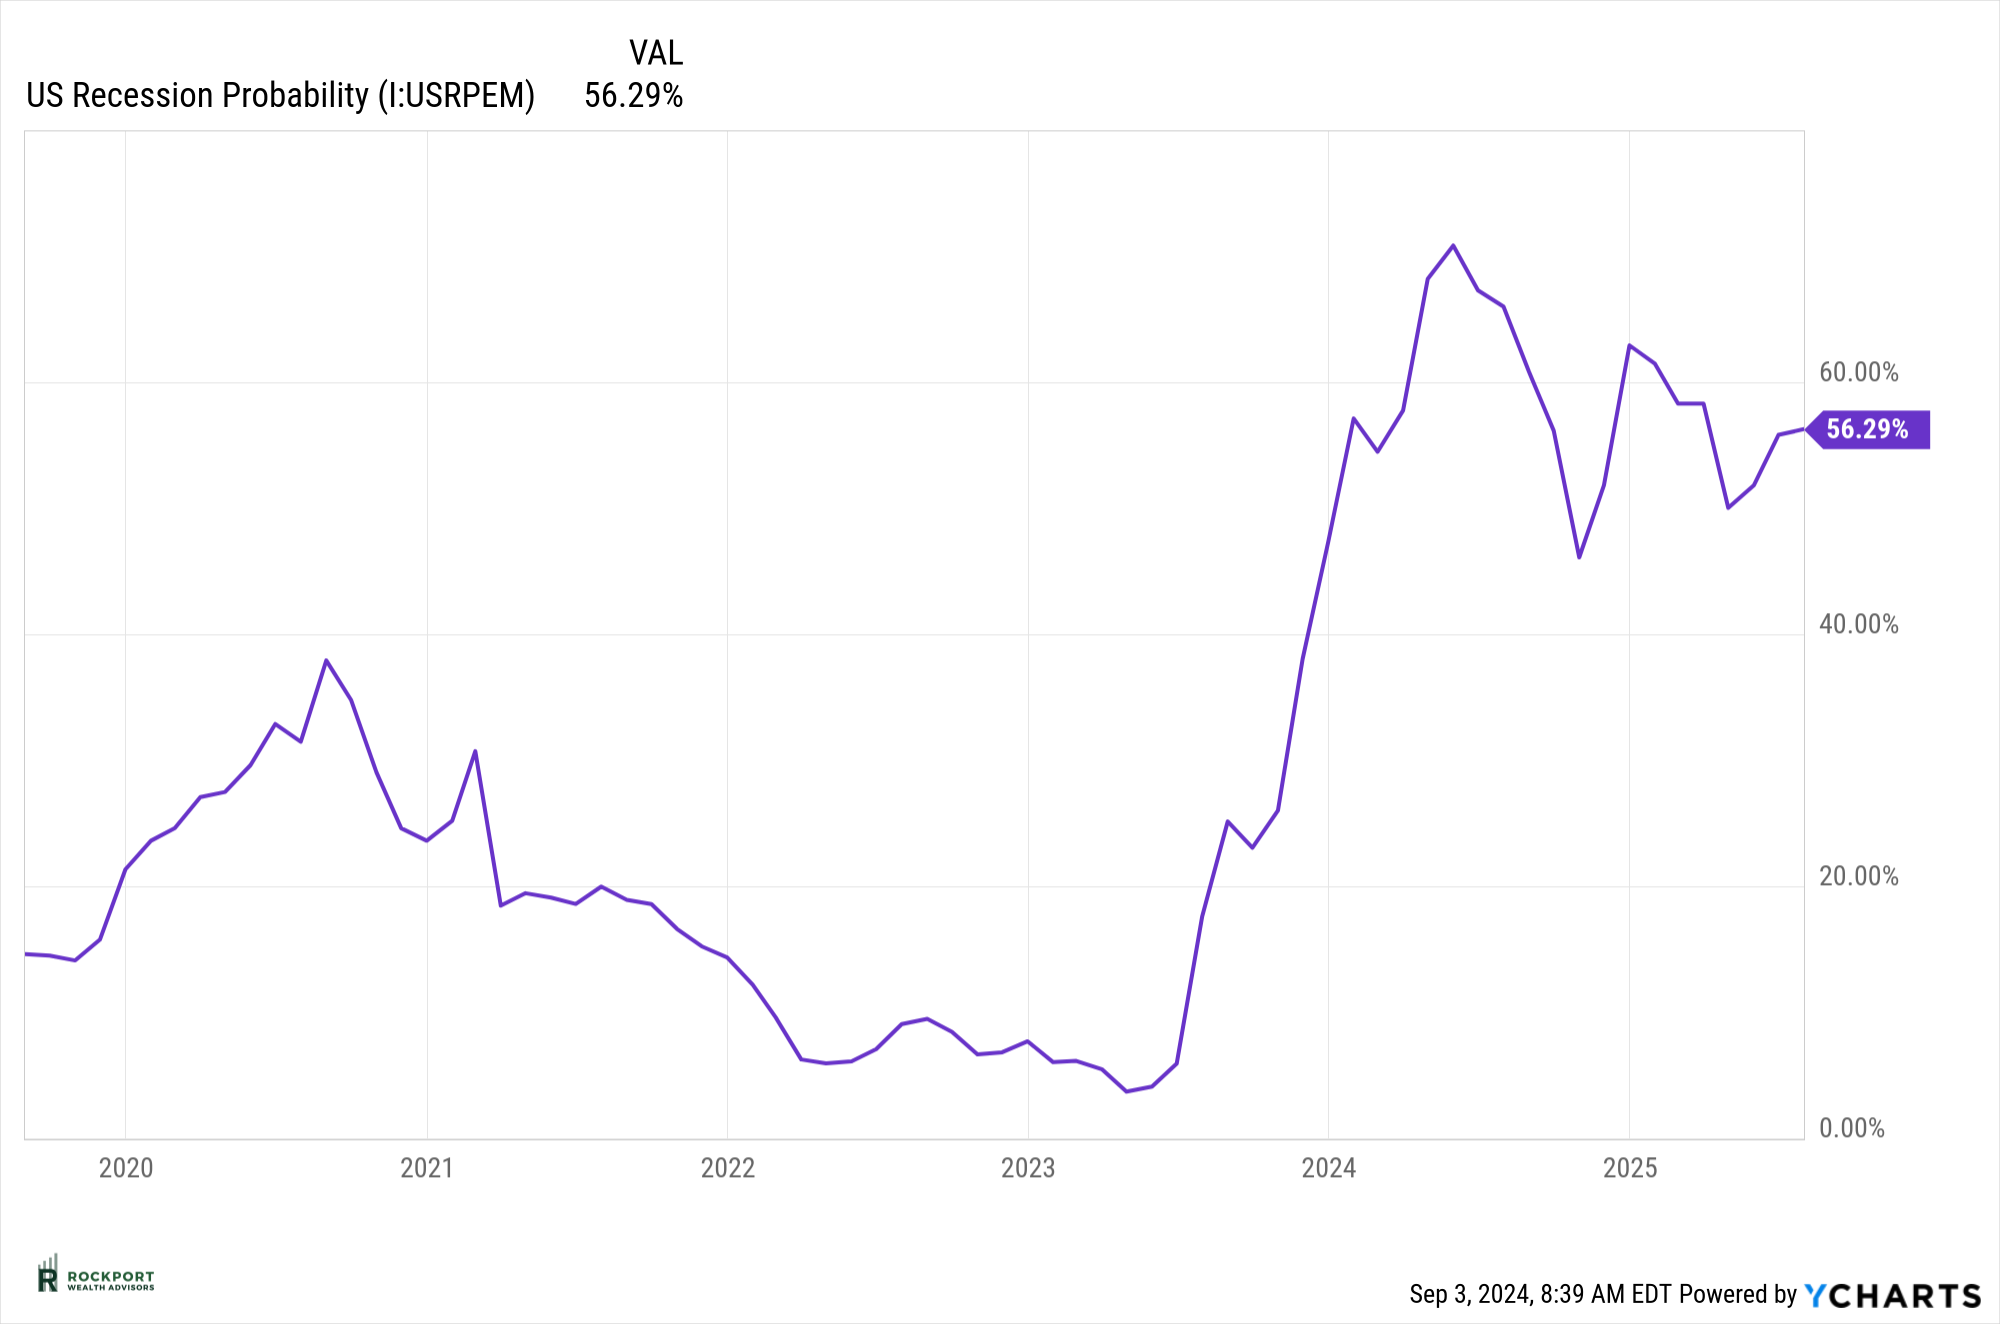
One additional note on employment: The monthly jobs report, typically released on the first Friday, has been showing a concerning trend. Initial job creation numbers have consistently been revised downward in subsequent months, making the labor market appear stronger at first than it actually is. For example, the June and July reports were recently revised down by a total of 86,000 jobs. This means that after revisions, July’s jobs report dropped from 114,000 to just 89,000 jobs—one of the weakest reports since December 2000. The reason for this pattern remains unclear, and it’s uncertain why the initial numbers are not more accurate. This trend is worth closely monitoring, as it signals further weakness in the job market.
Lastly, the year-long debate over whether a recession is imminent continues, with stocks and bonds telling different stories. Stocks are trading as if a recession is off the table, while bonds reflect a market bracing for one. Looking back over the past 30 years, it’s hard to find a period where economic data has been so at odds with stock market performance. The key takeaway may be that in the world of investing and economics, nothing is ever guaranteed. Outcomes can unfold in unexpected ways, often with little warning.
Tax Talk
The Roth IRA Five-Year Rules
Clients can ALWAYS take a distribution of basis from Roth IRAs. Basis is annual contributions and converted amounts. Those distributions will not be taxed when they are withdrawn as they were subject to tax when they went into the Roth IRA (or they were already after-tax amounts).
Ordering Rules: There are ordering rules for Roth distributions. All Roth IRAs are treated as one Roth IRA account for purposes of the distribution rules. Contributions come out first. Converted amounts come out next – first in, first out, funds that were taxable at the time of conversion come out before funds that were not taxable at the time of conversion. Earnings come out last.
Qualified Distributions: Distributions must be qualified to be free of all tax and penalties. Client must have had a Roth IRA (any Roth IRA) for five years, AND must be 59 ½ OR the distribution is due to death, OR the distribution is due to the disability of the account owner, OR the distribution qualifies for the first time home buyer exception. The five years start with the establishment of the first Roth IRA and covers all future Roth IRAs that may be established. In other words, it only runs once.
Rule #1 – Applies to all Roth IRAs and determines if distributions of earnings are taxable If a distribution is qualified (see above), all funds come out of the Roth IRA income tax and penalty free. If the distribution is not qualified, a distribution of earnings (see ordering rules above) will be subject to income tax and the early distribution penalty, if applicable.
Rule #2 – Applies to all Roth conversions (including conversions from employer plans) If converted amounts are distributed (see ordering rules above) before they have been held for five years, AND the account owner is under the age of 59 ½ at the time of the distribution, the 10% early distribution penalty will be applied to the amount of the distribution. (If after-tax amounts were converted to the Roth, then the distribution of the after-tax amounts will never be subject to the penalty.) This rule applies separately to each conversion. If conversions are done in three different years, you have three different five-year holding periods to track.
Rockport News
Salute To Service Golf 2024
Our Salute to Service Golf Outing was a huge success once again. Thank you so much for all your donations and participation. We were able to raise $20,000 for our two benefactors The National Veterans Memorial and Museum and The Gallant Few. Click here Salute to Service Photos & Videos to see some photos and video from this years event.
As always, if you have any questions on anything we have talked about here or anything else that is on your mind, please feel free to reach out.
*The Standard & Poor’s 500 (S&P 500) is an unmanaged group of securities considered to be representative of the stock market in general. Results can be found at slickcharts.com.
*Treasury yields can be found at finance.yahoo.com.
*Charts produced at yCharts.com
*Bonds can be found at bloomberg.com/markets/rates-bonds
*Fed Rate Probability Chart can be found at cmegroup.com/markets/interest-rates/cme-fedwatch-too
*The LEI can be found at conference-board.org/topics/us-leading-indicators
*Treasury Yield Curve can be found at Gurufocus.com
*University of Michigan Consumer Confidence produced at SentimenTrader
*Rockport Models – Please remember we are referencing our model portfolios, and your portfolio may differ from the models mentioned depending on your individual needs and circumstance.

