
We are off and running in 2024! We hope this Newsletter finds you well.
Markets & Economy
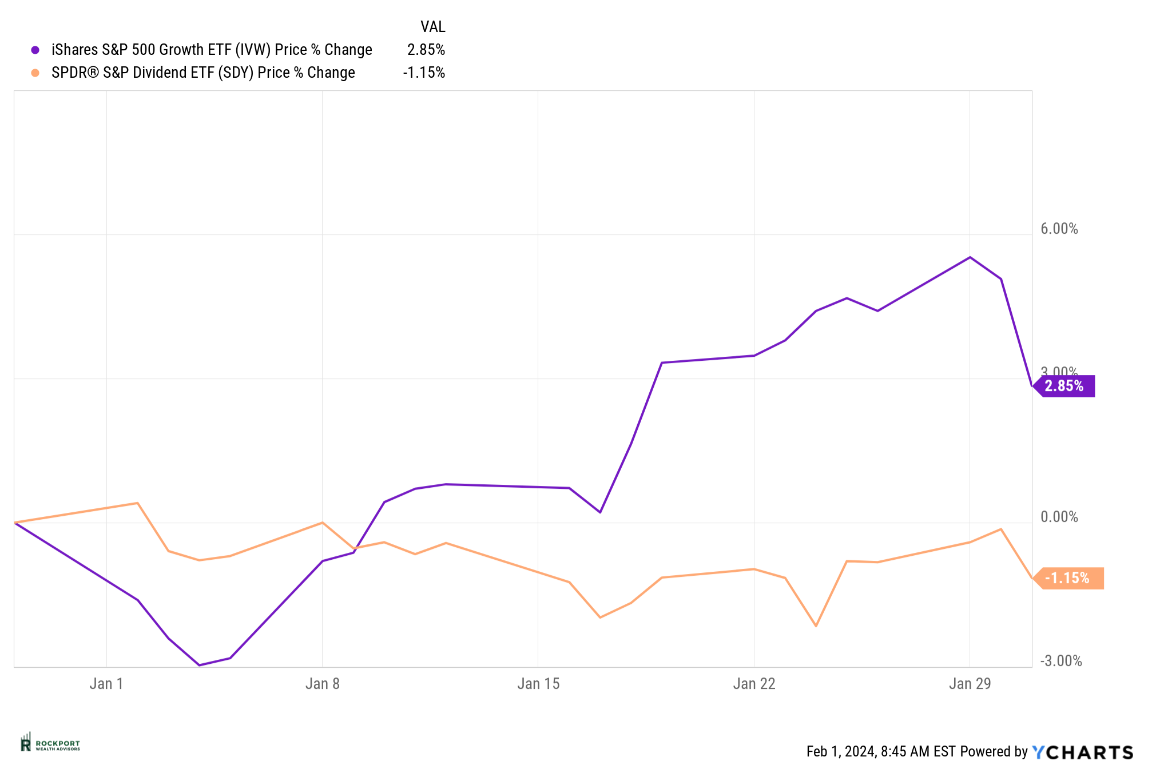
As we embark on the new year, markets have carried forward the positive momentum from the end of 2023. In January, the S&P 500 showed a 1.68% increase, while the S&P 500 Equal Weight experienced a slight decline of -0.85%. Consequently, the market reverted to a narrow leadership style, marking the end of any expansion observed in November and December. Essentially, the dominant trend of the “Magnificent 7” (now reduced to 6 following Tesla’s stock decline) has resumed, leaving numerous stocks lagging behind. Market breadth remains poor, with more stocks hitting new lows than highs on a daily basis. The implications of this trend are uncertain, historically signaling a negative trend. Another reflection of this narrow market lies in the notable outperformance of Growth stocks compared to Value stocks, further indicating a lack of diversity in the market. 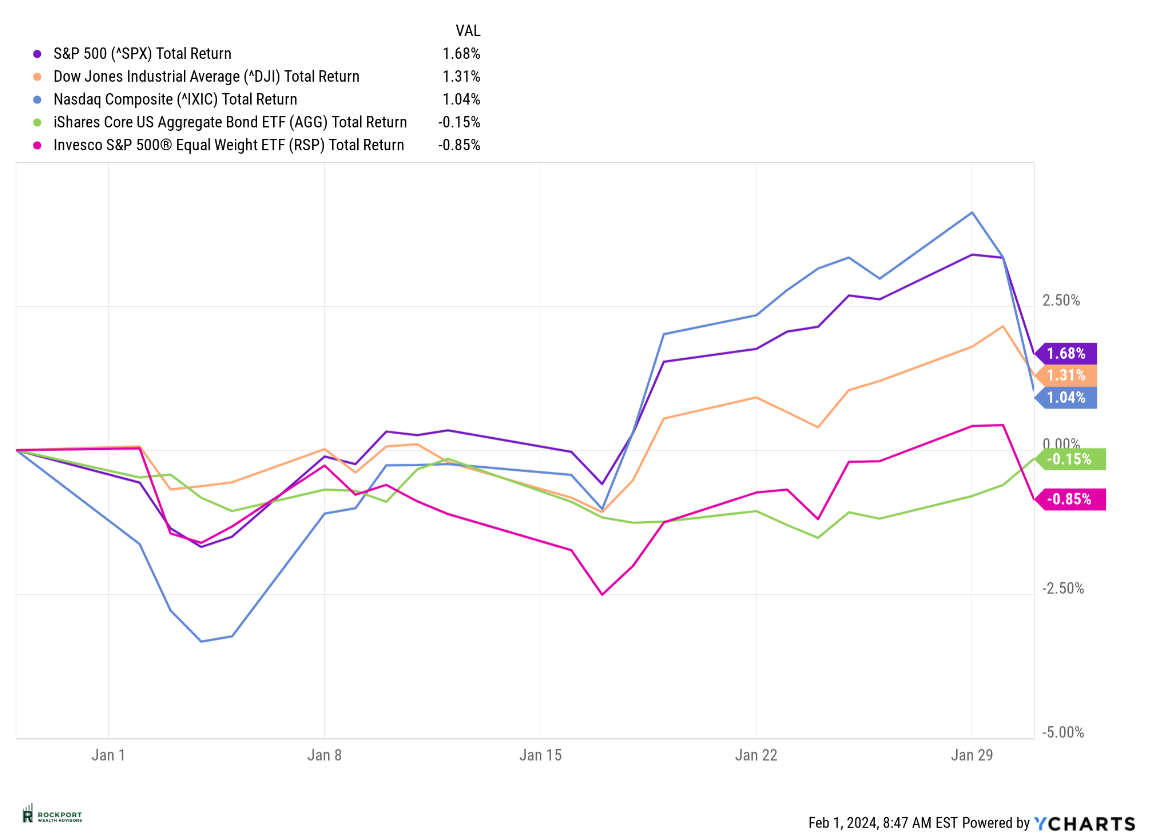
An intriguing development worth noting is the shift in expectations regarding interest rate cuts between the stock market and the Federal Reserve. As discussed in last month’s newsletter, at the close of the year, the stock market anticipated 6-7 interest rate cuts, whereas the Fed’s projection stood at 2-3. However, due to stronger-than-anticipated economic data and persistent inflation levels exceeding the Fed’s target, these expectations have moderated. Currently, the stock market anticipates 5 rate cuts.
Previously, a March interest rate cut seemed plausible, but as of the latest update, the likelihood has dwindled to less than 20%. However, there’s still a 60% chance of a rate cut in May. These figures are dynamic and subject to daily fluctuations, yet it’s evident that expectations for rate cuts are diminishing at present. It will be intriguing to observe whether the market or the Fed proves to be accurate as the year unfolds.
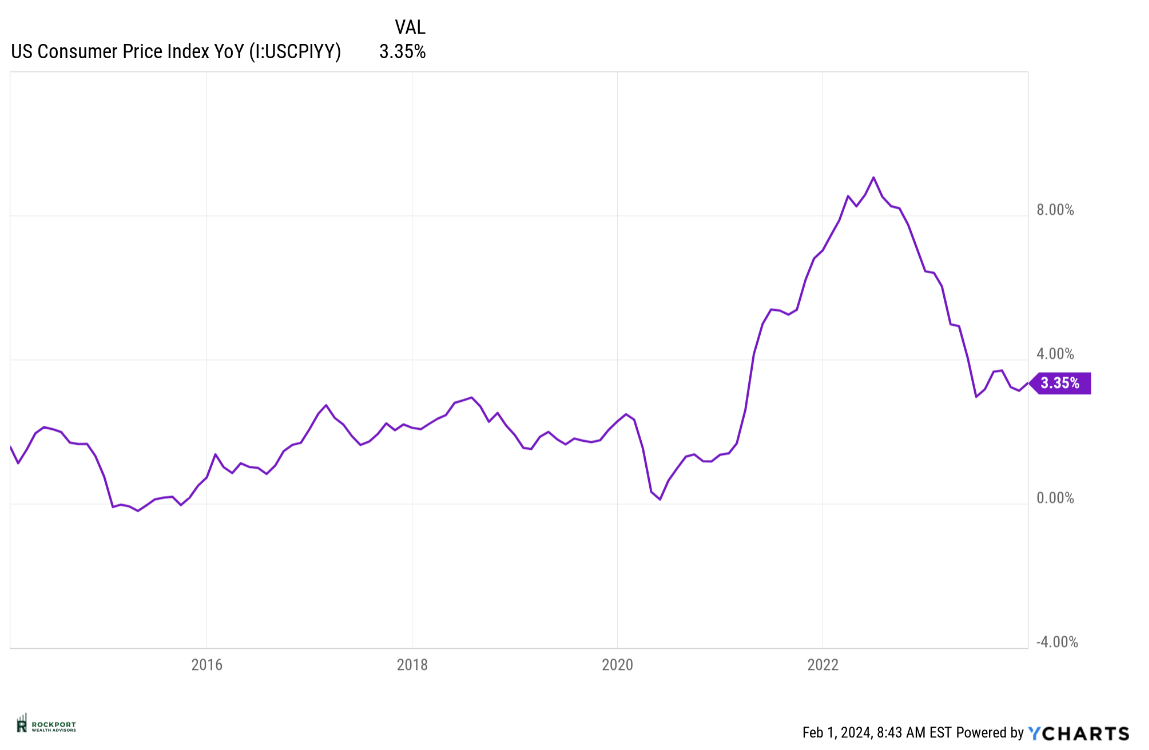
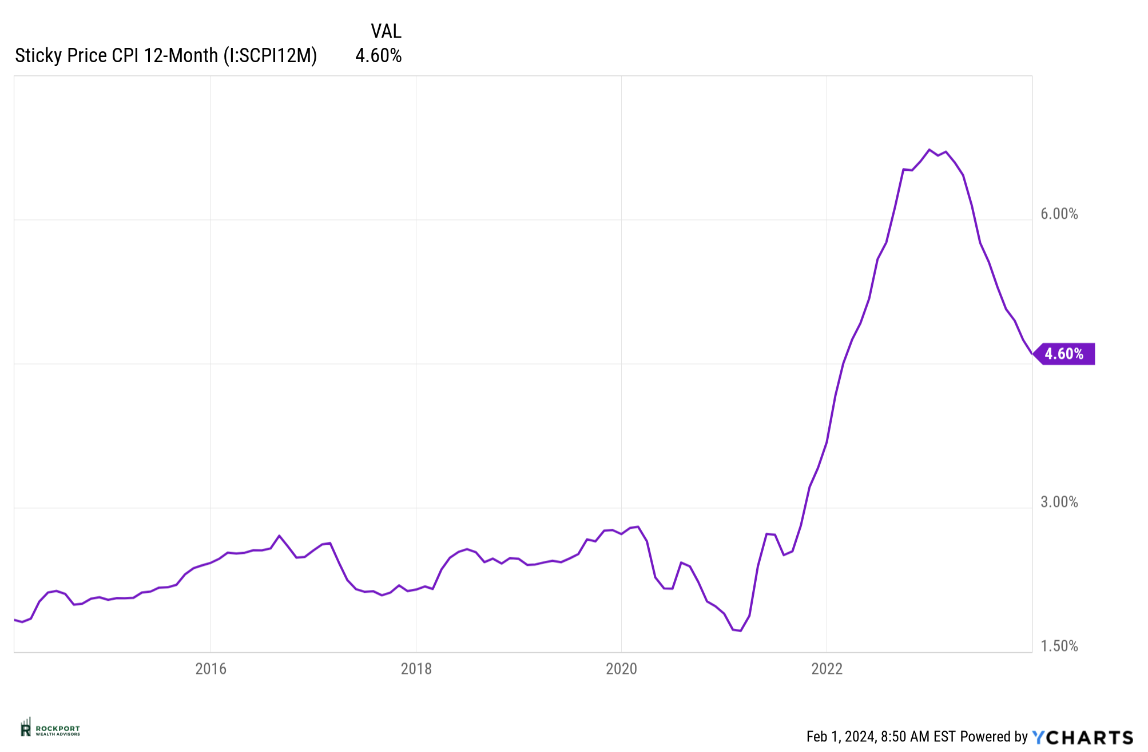
Inflation, as gauged by the CPI and Sticky CPI, remains elevated compared to the Federal Reserve’s preferences. Despite reaching a peak of over 9% in July 2022, the CPI has remained within the range of 3.1-3.4% for several months. It’s important to highlight the significant progress made in combating inflation within a relatively short timeframe. However, achieving the Fed’s target of 2% inflation has proven to be challenging.
A common question we receive pertains to why prices for goods and services haven’t decreased despite the decrease in inflation. The primary reason is that while we’re experiencing disinflation, where prices are rising at a slower rate, we’re not in a state of deflation, where prices actually decline. To put it differently, even with inflation at 3.35%, prices are still increasing, albeit at a slower pace compared to 2022.
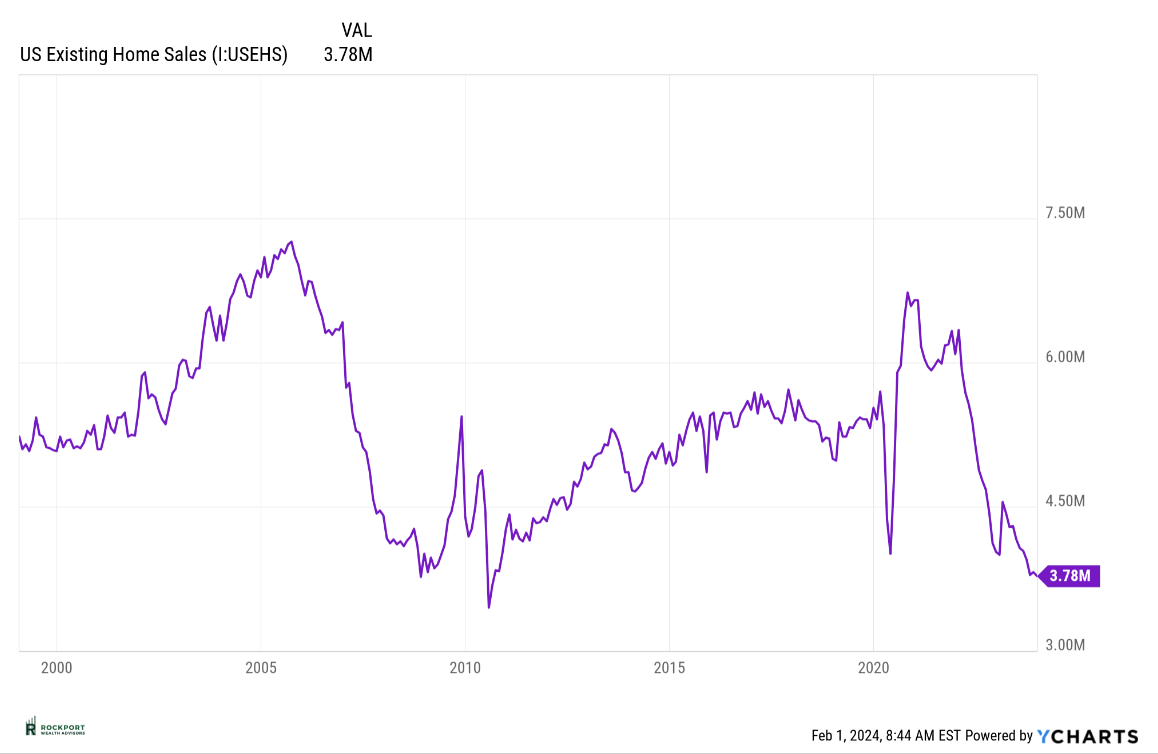
The housing market has been a prominent subject since the onset of the COVID-19 pandemic in 2020. As depicted in the chart below, existing home sales have experienced a significant decline, returning to levels reminiscent of those seen in 2010. It’s noteworthy that despite this decline, our realtor clients report instances of homes being sold at full price and spending relatively brief periods on the market.
Several factors contribute to this dynamic, including persistently low inventory levels and 30-year mortgage interest rates hovering near 7%. Despite these challenges, housing prices have not experienced significant declines. It’s important to recognize that the housing market operates at a slower pace compared to the rapid fluctuations seen in stock and bond markets. Therefore, it will be intriguing to observe how this market evolves throughout the remainder of 2024.
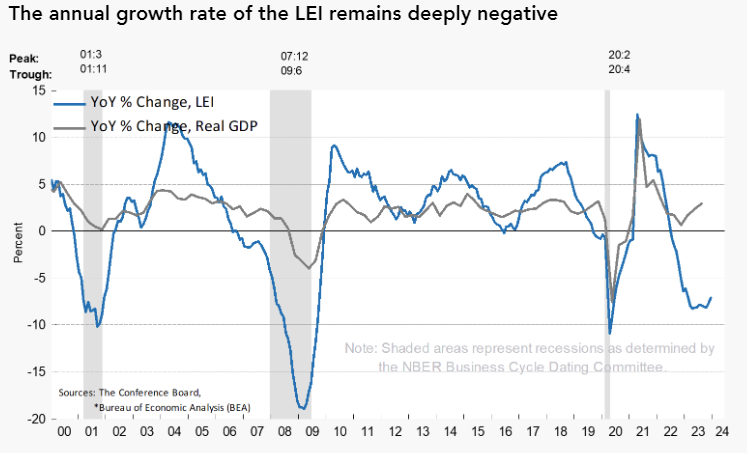
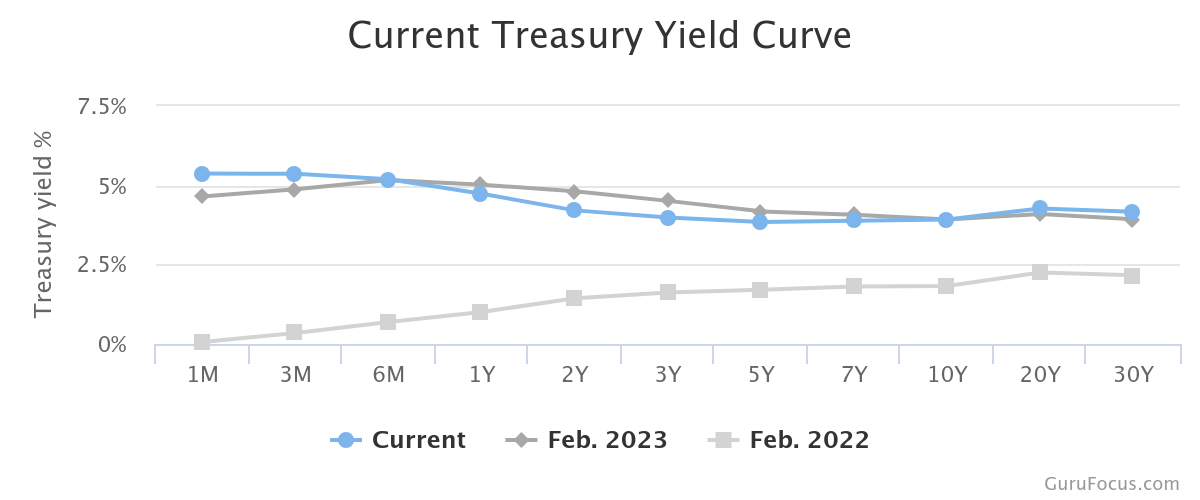
Despite the risk of sounding redundant, we remain vigilant in monitoring for signs of a potential recession. The Leading Economic Index (LEI) persistently indicates weaknesses in the underlying economy. Although the inverted yield curve, historically associated with economic downturns, remains uncorrected, it’s worth noting that such occurrences don’t always lead to economic weakness.
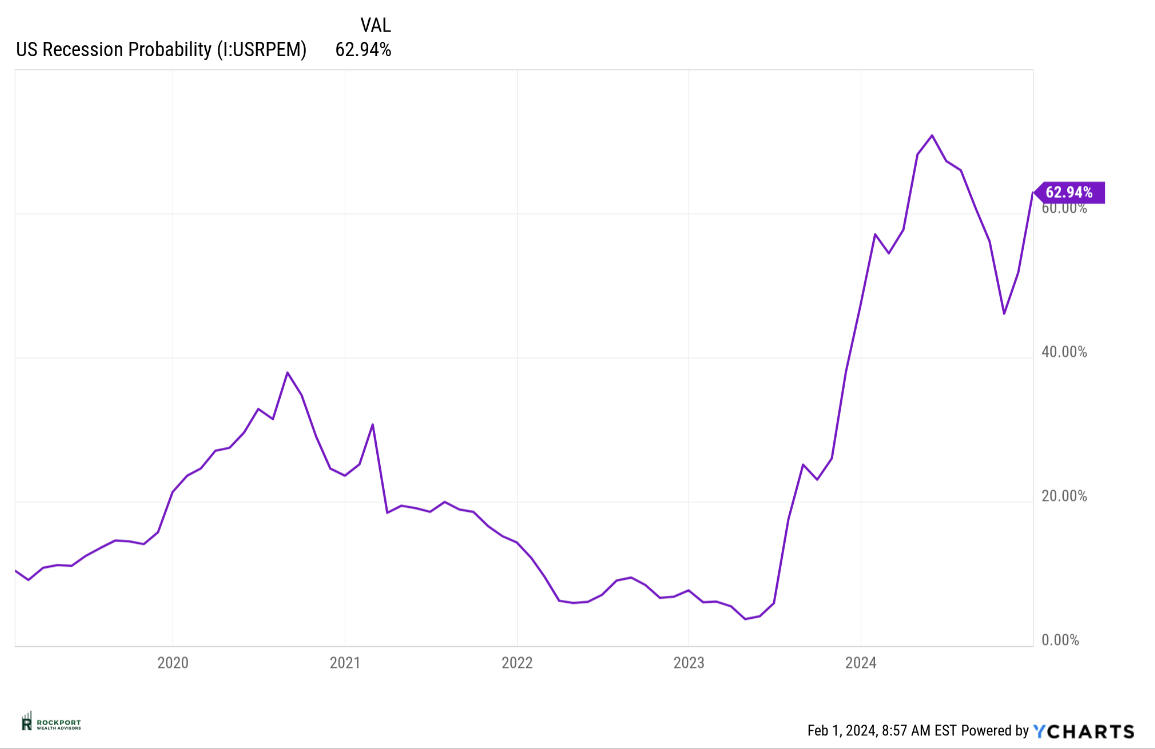
Additionally, the New York Fed’s recession probability model continues to signal a historically high likelihood of occurrence. Perhaps most concerning is the Federal Reserve’s somewhat optimistic stance, despite its track record of unreliable predictions. Reflecting on past events, such as the optimistic sentiments expressed by then-Fed Chair Janet Yellen in mid-2007, only to be followed by the deepest recession since the Great Depression, underscores the importance of maintaining a cautious outlook.
While we’re not forecasting a scenario akin to 2008, it’s evident from the data points above that a more prudent approach is warranted.
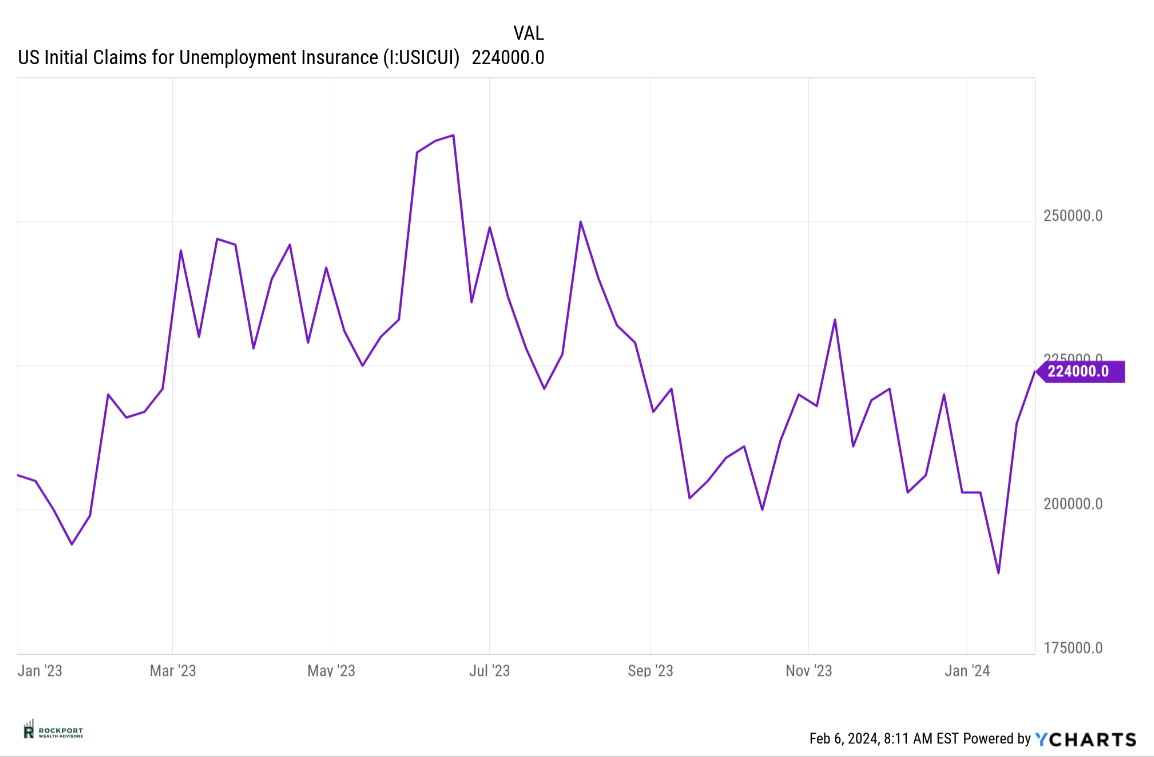
Lastly, let’s touch on the current employment landscape, which remains somewhat uncertain. Initial claims for unemployment are showing an uptick, although it’s not yet cause for significant concern. Similarly, continuing claims for unemployment are also increasing. However, a closer look reveals a decline in hours worked, a trend often observed during recessionary periods. These indicators require careful monitoring as we progress through the year, as their persistence could strengthen the case for a recession.
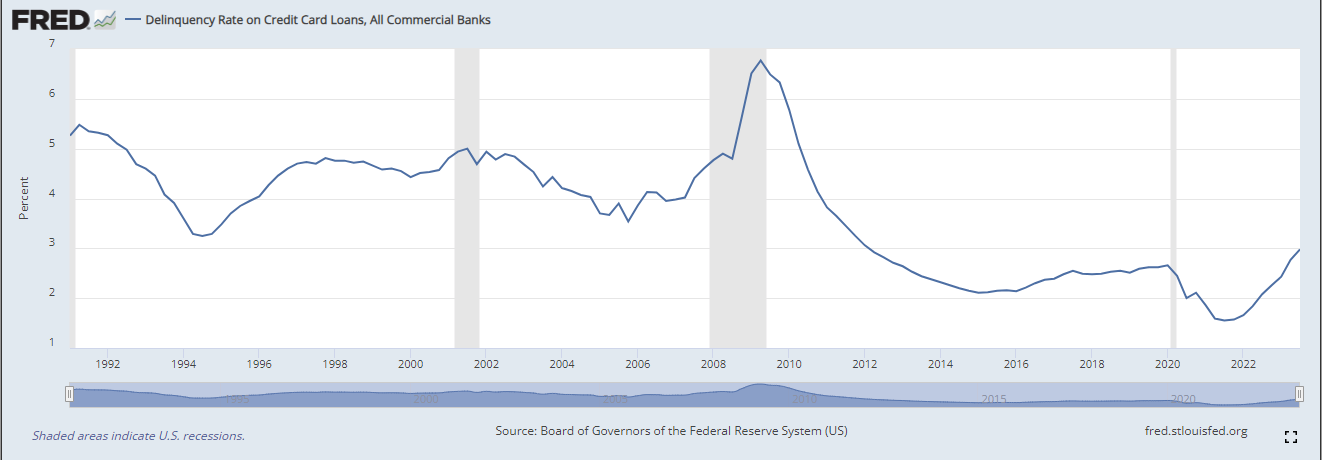
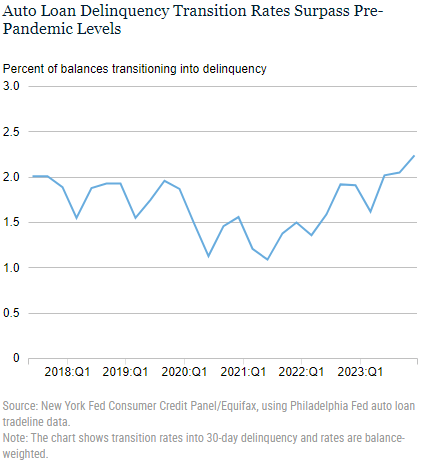
As we’ve emphasized in previous newsletters, consumer resilience has been a crucial factor in sustaining economic strength over the past couple of years. Typically, consumer behavior aligns closely with job market conditions. Presently, there are signs of strain evident in the consumer sector, as illustrated by the charts depicting credit card and auto loan delinquencies below. Therefore, the stability of the job market holds paramount importance at this juncture.
To conclude this month’s newsletter, it’s tax season—a time that many eagerly anticipate, I’m sure! As a friendly reminder, 1099 tax forms will soon be arriving in your mailbox, if they haven’t already. Typically, 1099 forms for IRA distributions are the first to arrive, followed by 1099-DIV forms. However, please be aware that 1099-DIV forms may take until the end of February, or in rare cases, even longer to be issued.
If you have accounts at Pershing, Axos, or Schwab, we kindly ask for your patience in receiving these forms. However, if you’d like us to keep an eye out for you, please don’t hesitate to let us know.
As always, if you have any questions on anything we have talked about here or anything else that is on your mind, please feel free to reach out.
*The Standard & Poor’s 500 (S&P 500) is an unmanaged group of securities considered to be representative of the stock market in general. Results can be found at slickcharts.com.
*Treasury yields can be found at finance.yahoo.com.
*Charts produced at yCharts.com
*Bonds can be found at bloomberg.com/markets/rates-bonds
*Fed Rate Probability Chart can be found at cmegroup.com/markets/interest-rates/cme-fedwatch-too
*The LEI can be found at conference-board.org/topics/us-leading-indicators
*Treasury Yield Curve can be found at Gurufocus.com
*Rockport Models – Please remember we are referencing our model portfolios, and your portfolio may differ from the models mentioned depending on your individual needs and circumstance.