
Markets & Economy
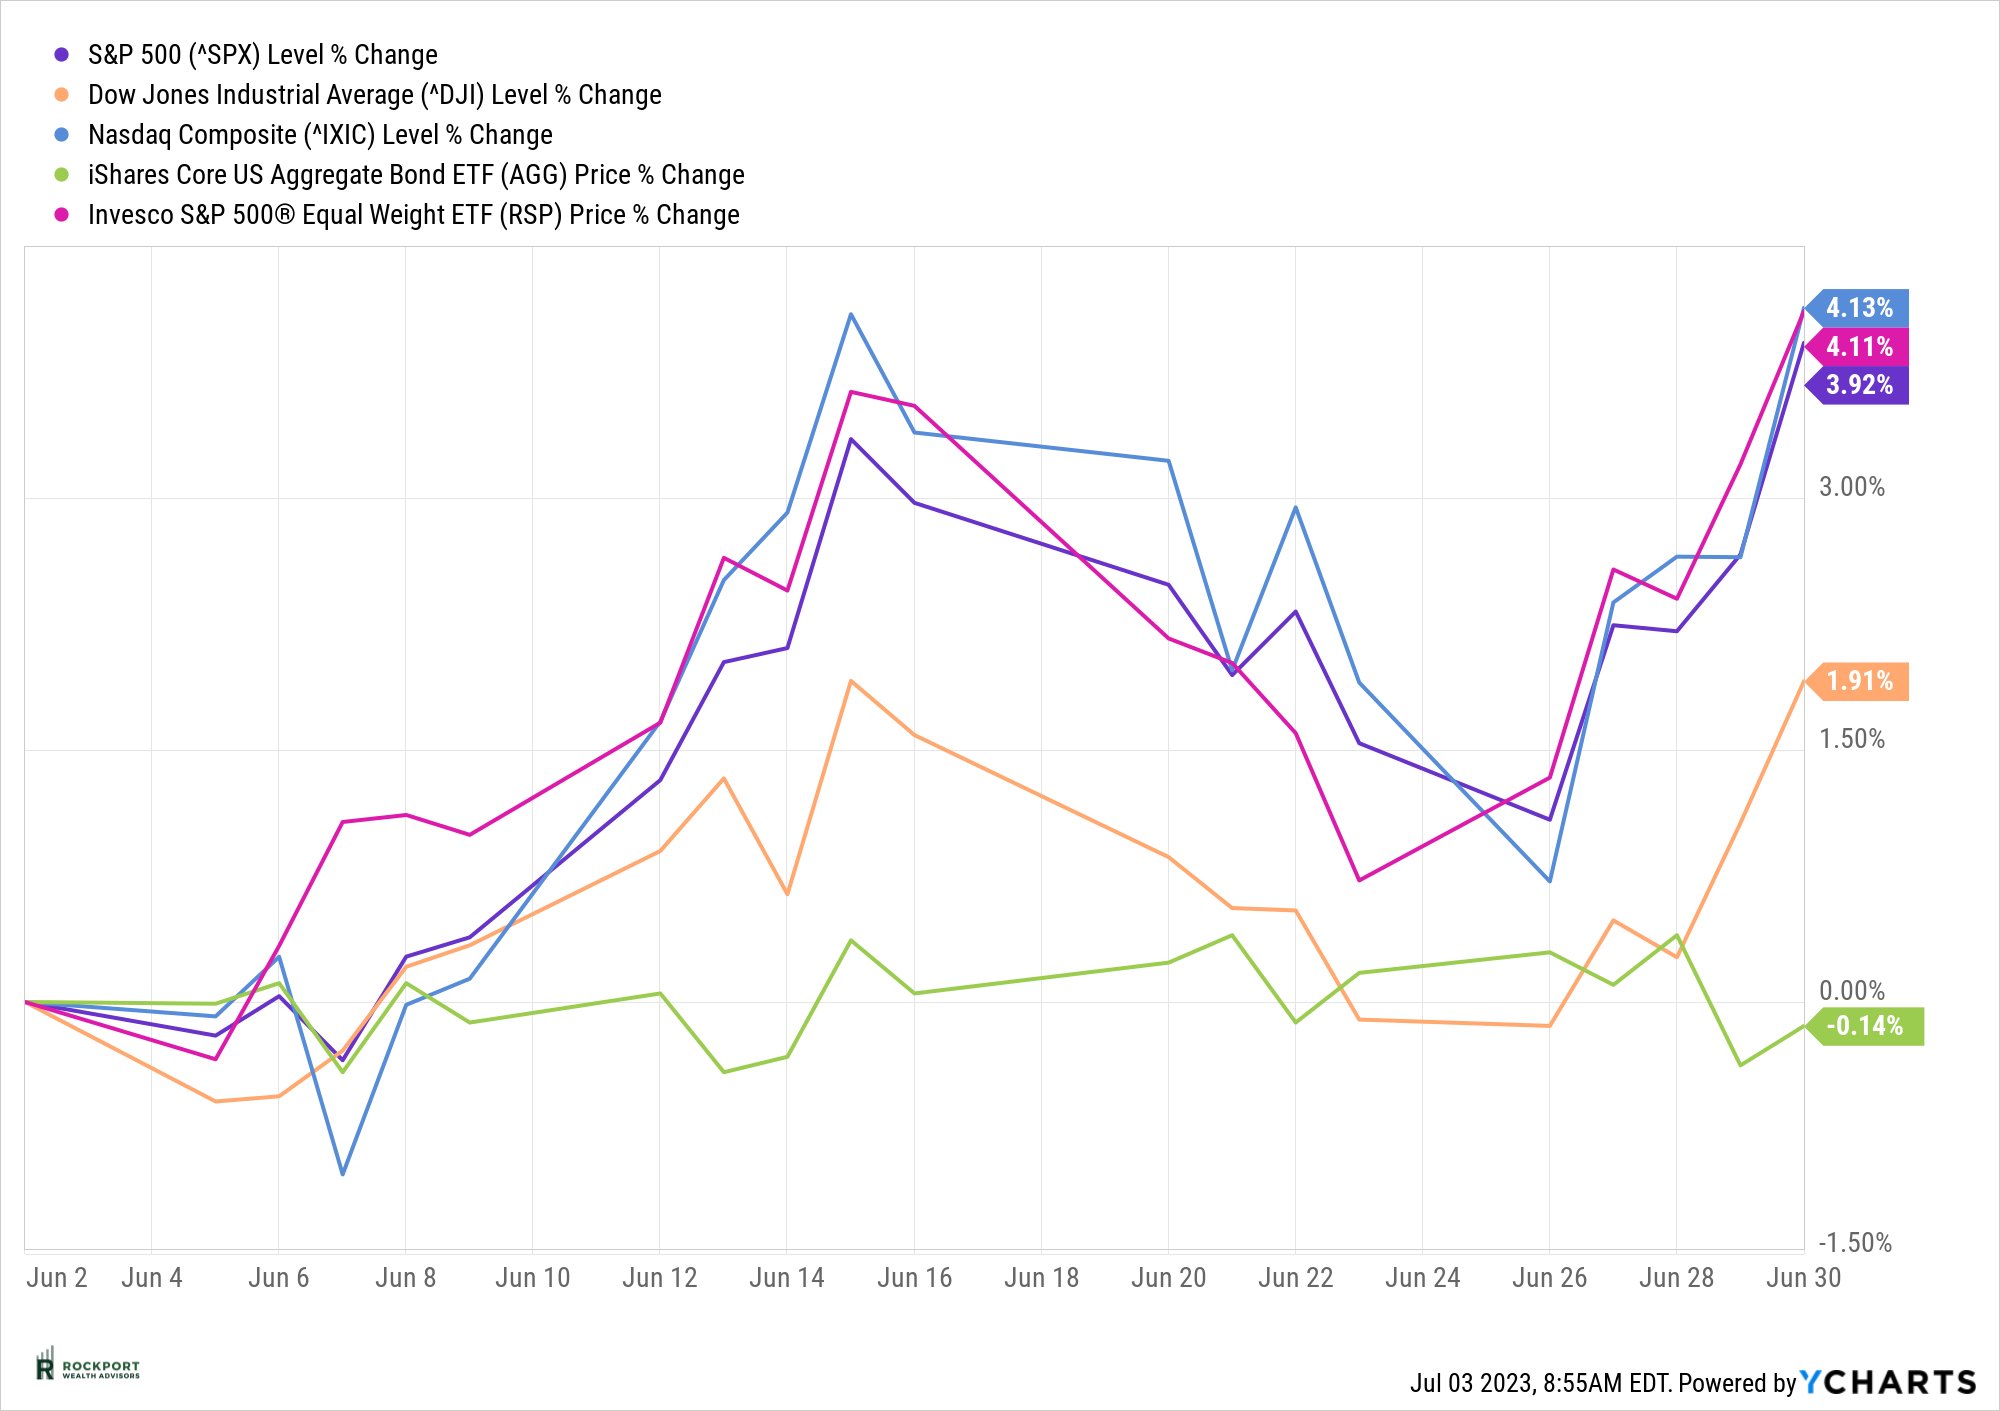
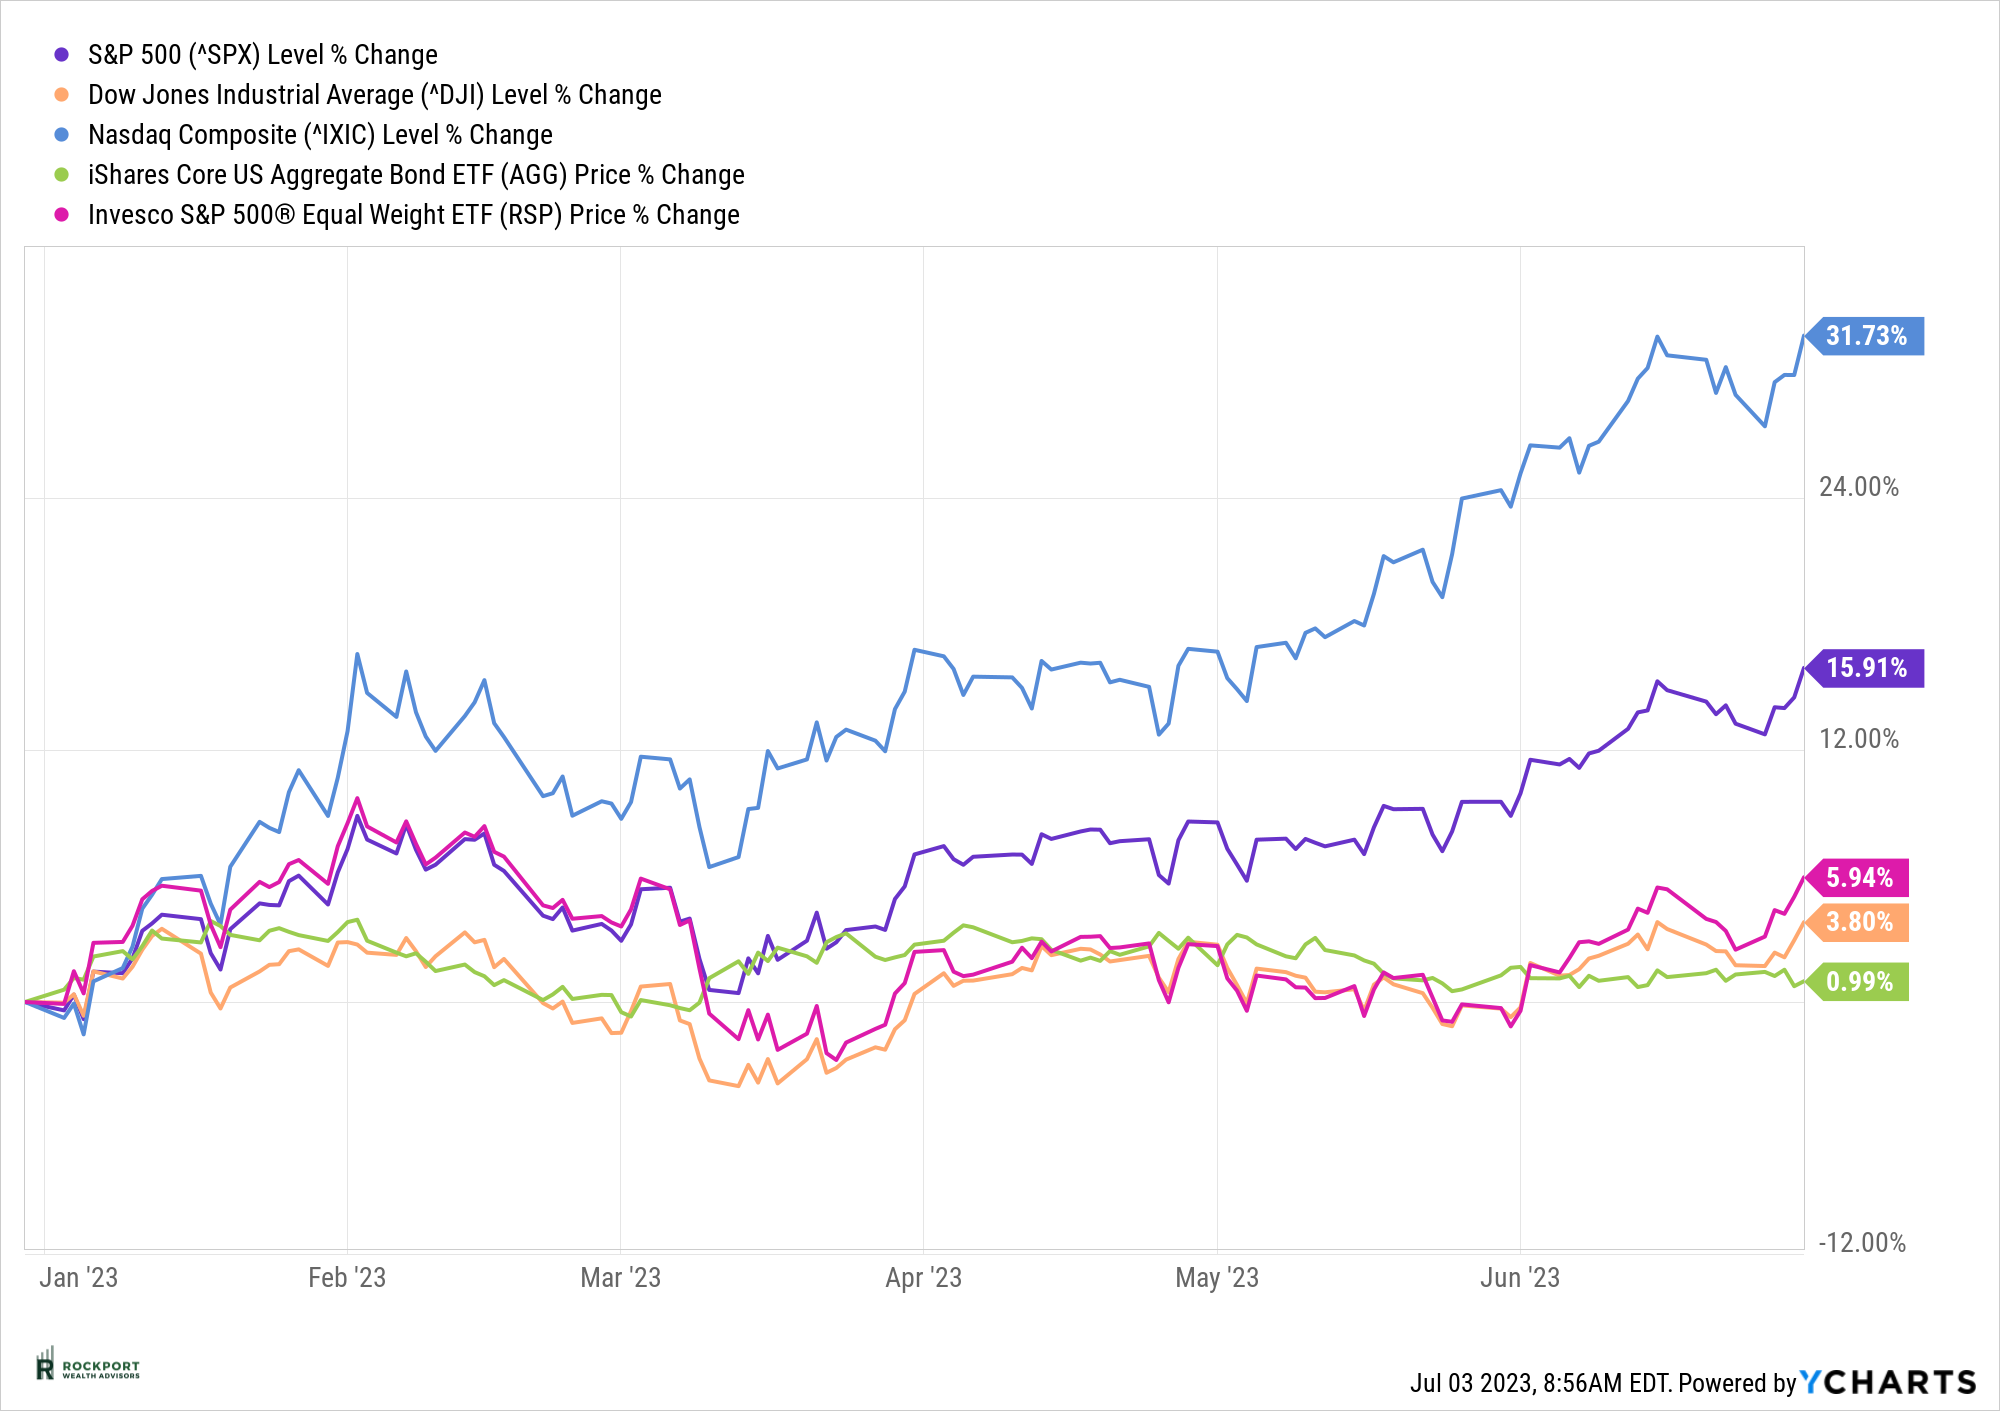
Happy 4th of July! Hopefully you had a great day of family and fun. It’s amazing that the first half of the year has already come to a close. June turned out to be another very good month for the markets with the S&P 500 index increasing 3.92% and an increase now of 15.91% for the year. The big winner for the year thus far has been the NASDAQ composite index which is up a stunning 31.73%. This particular index is loaded with high growth technology companies that have benefited from the Hype in AI (Artificial Intelligence). The divergence we mentioned in the last newsletter about a small handful of stocks driving the returns in the indexes did improve a little bit as the S&P 500 equal weight index is now up 5.94% year to date. Still a long way to go to close this gap though.
So, as we enter the second half of 2023, let’s take a look at some of the good and some of the not so good things occurring economically.
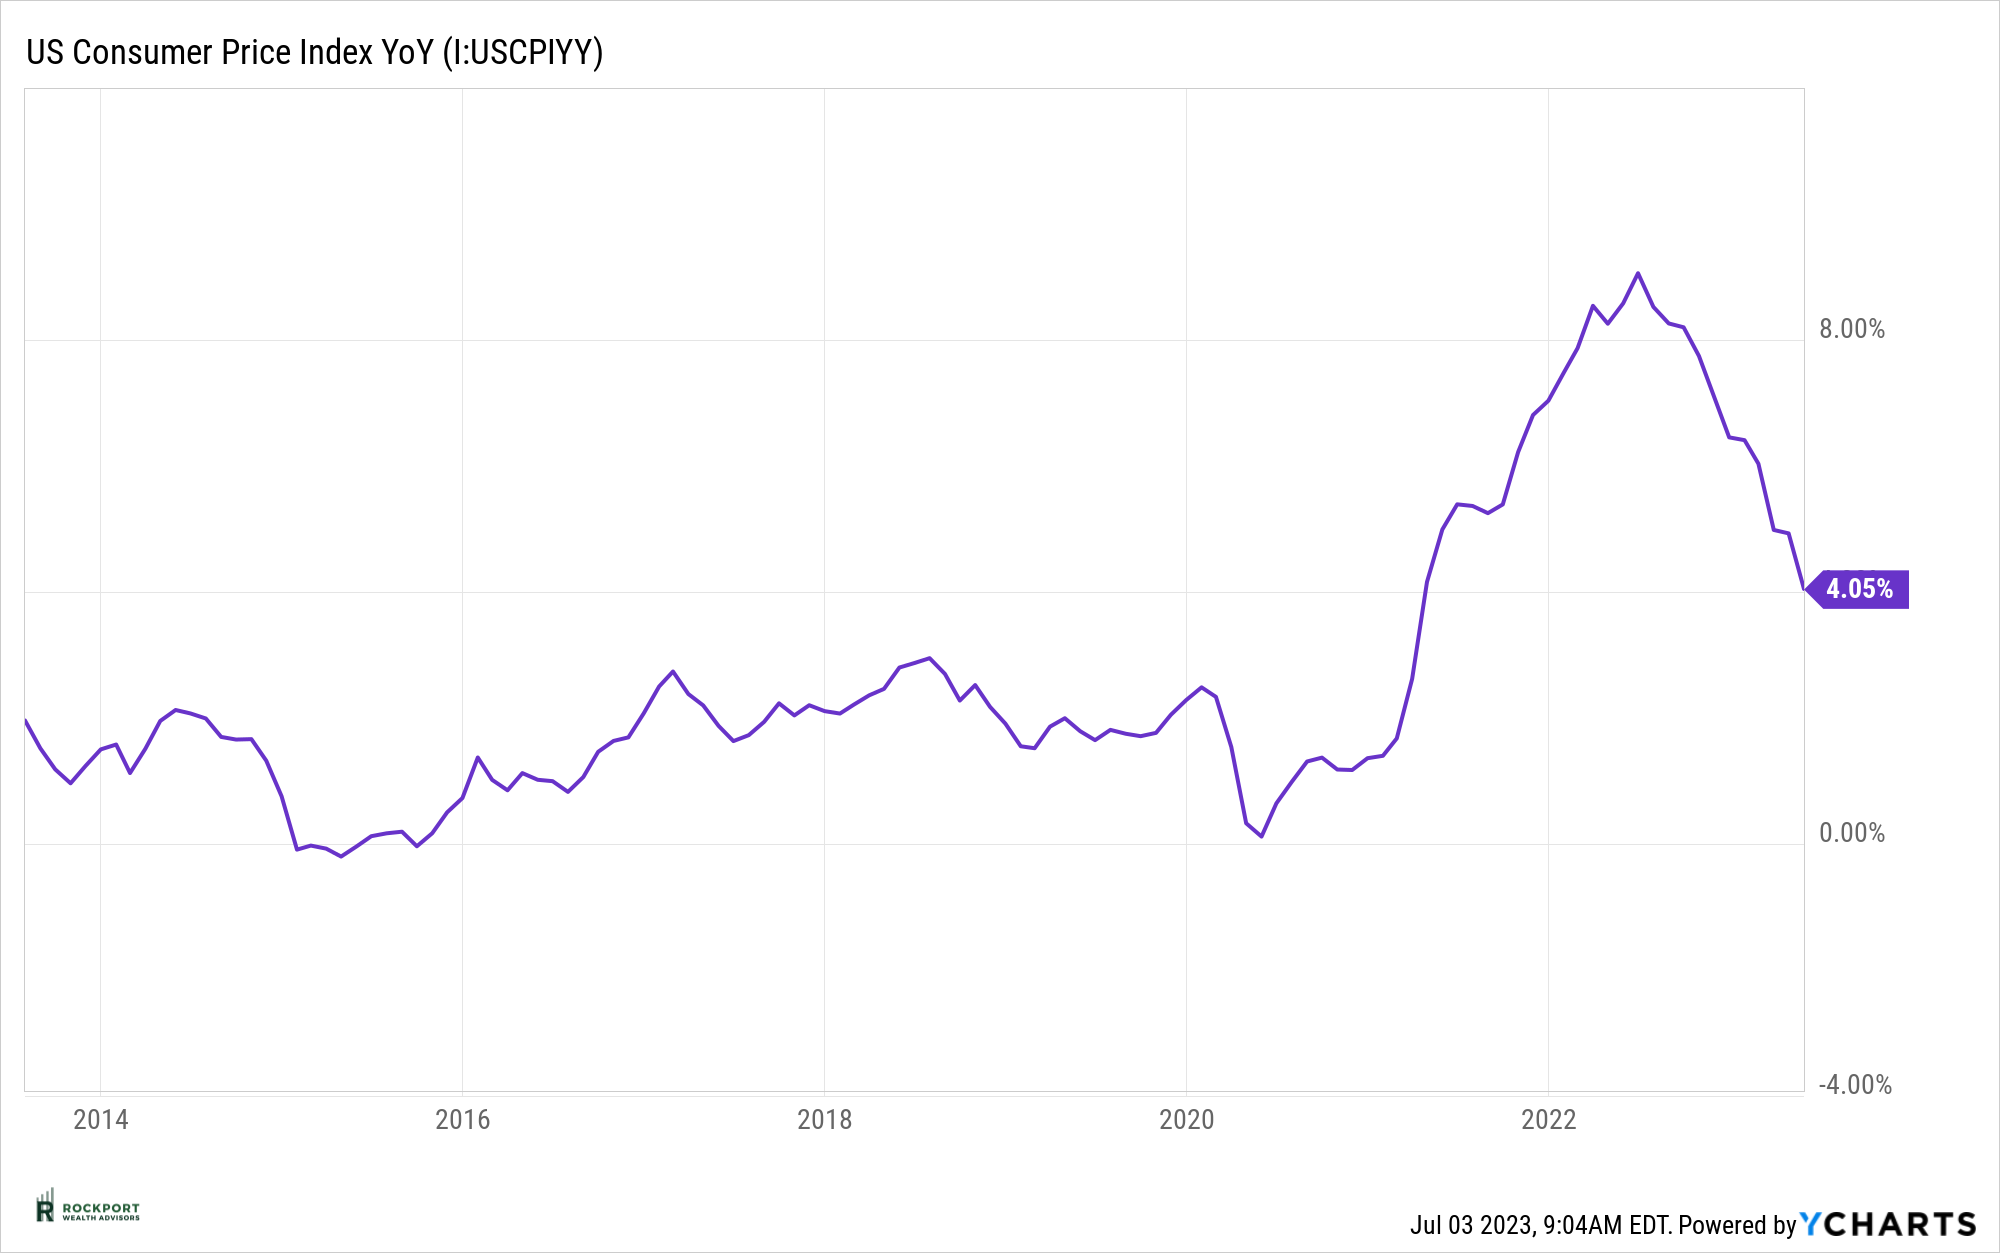
The Good: CPI has continued to cool and is now down to 4.05% year over year increase. This is the lowest reading since April 2021. Also to the good is employment, which continues to remain strong. We can’t underestimate the importance of this as it’s tough to have a bad recession if everyone is working and has money to spend. Lastly, the Federal Reserve seems to be nearing the end of its interest rate increasing cycle with perhaps another couple quarter point increases before they are hopefully done. For the record, they did not increase rates in June, which we had mentioned was a possibility last newsletter. Of course, this situation is always fluid, and they can change course at any time.
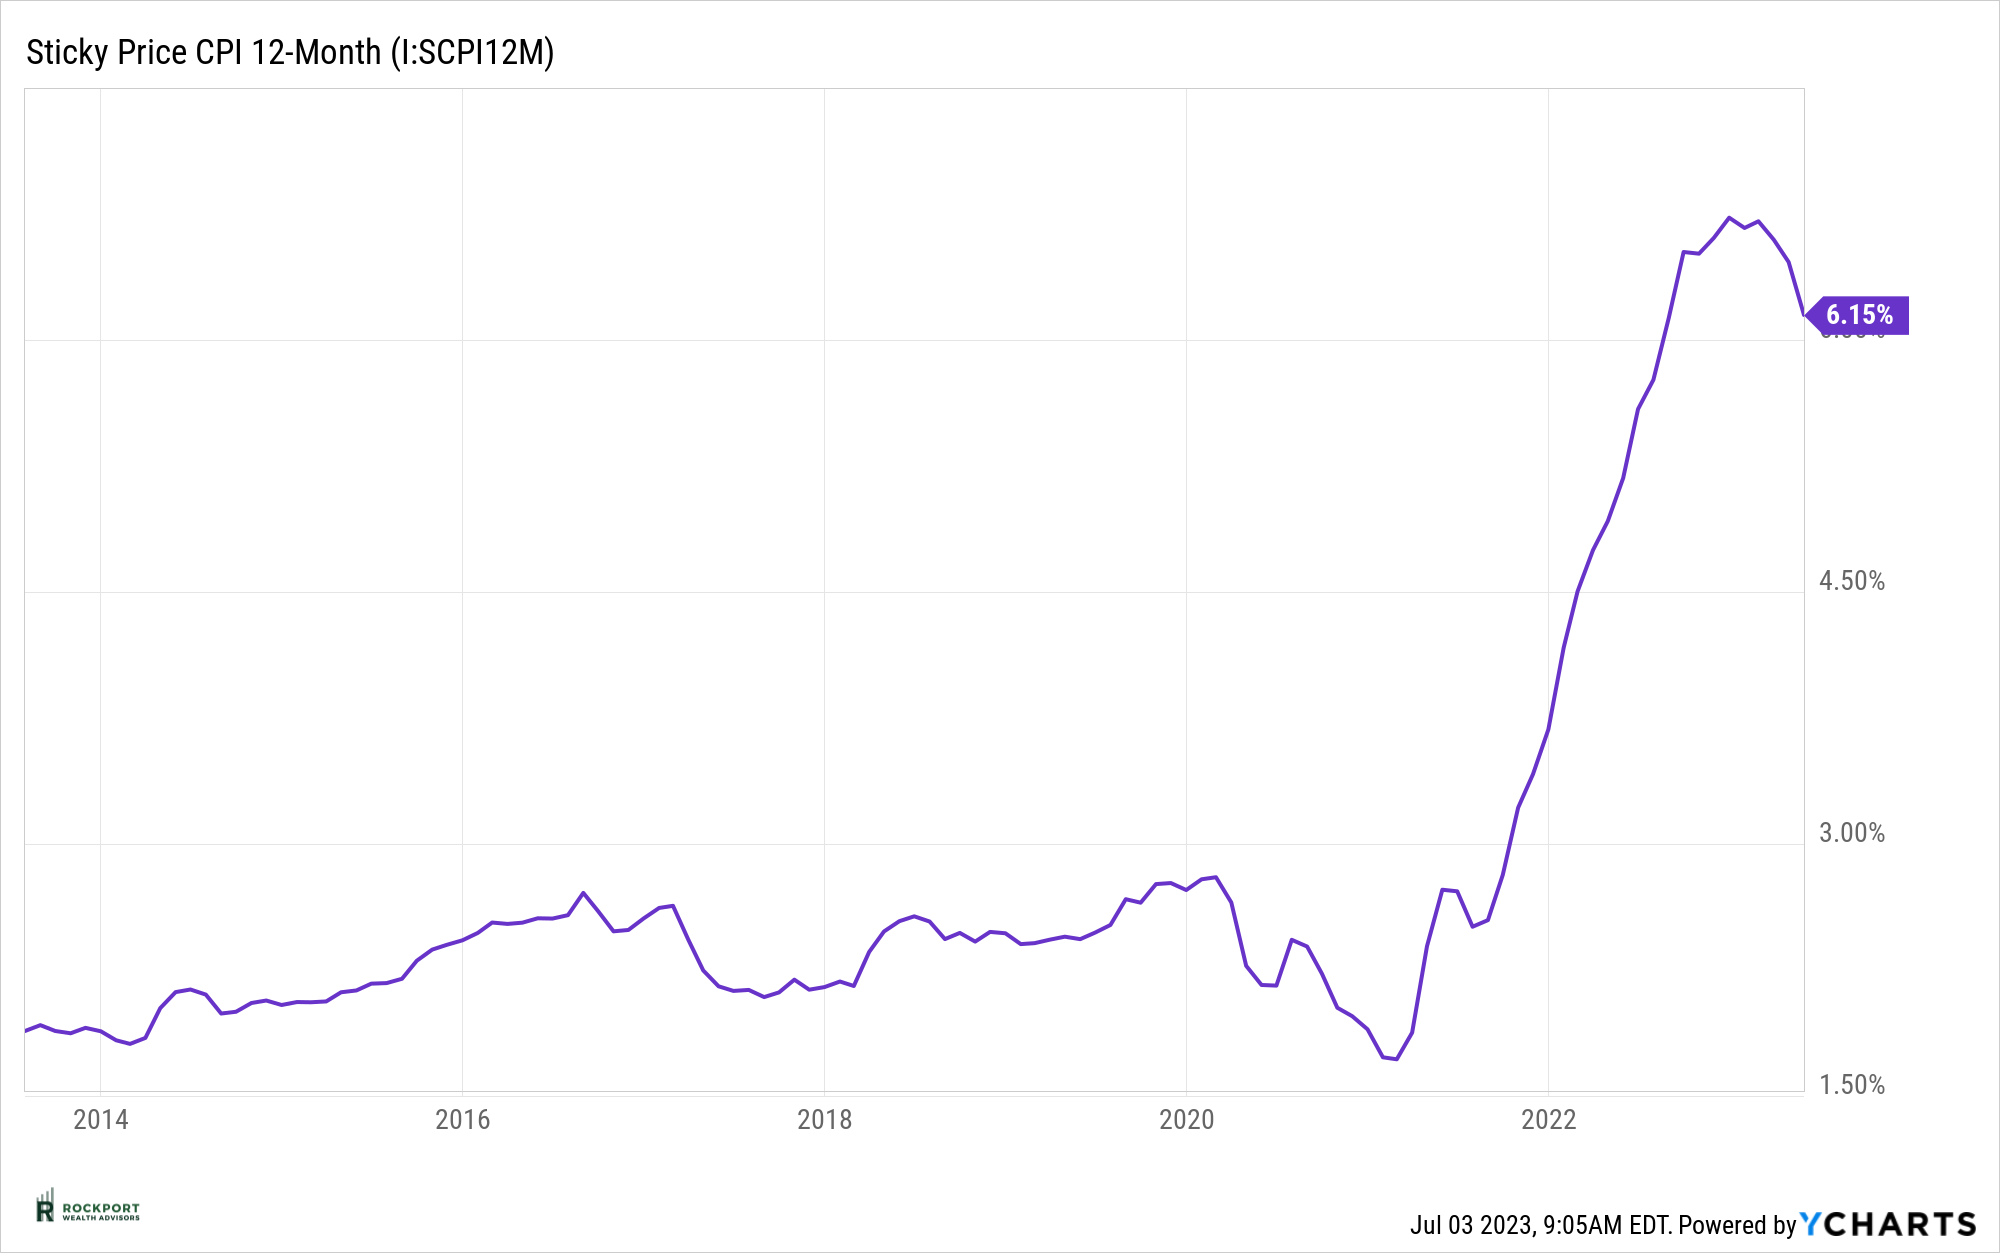
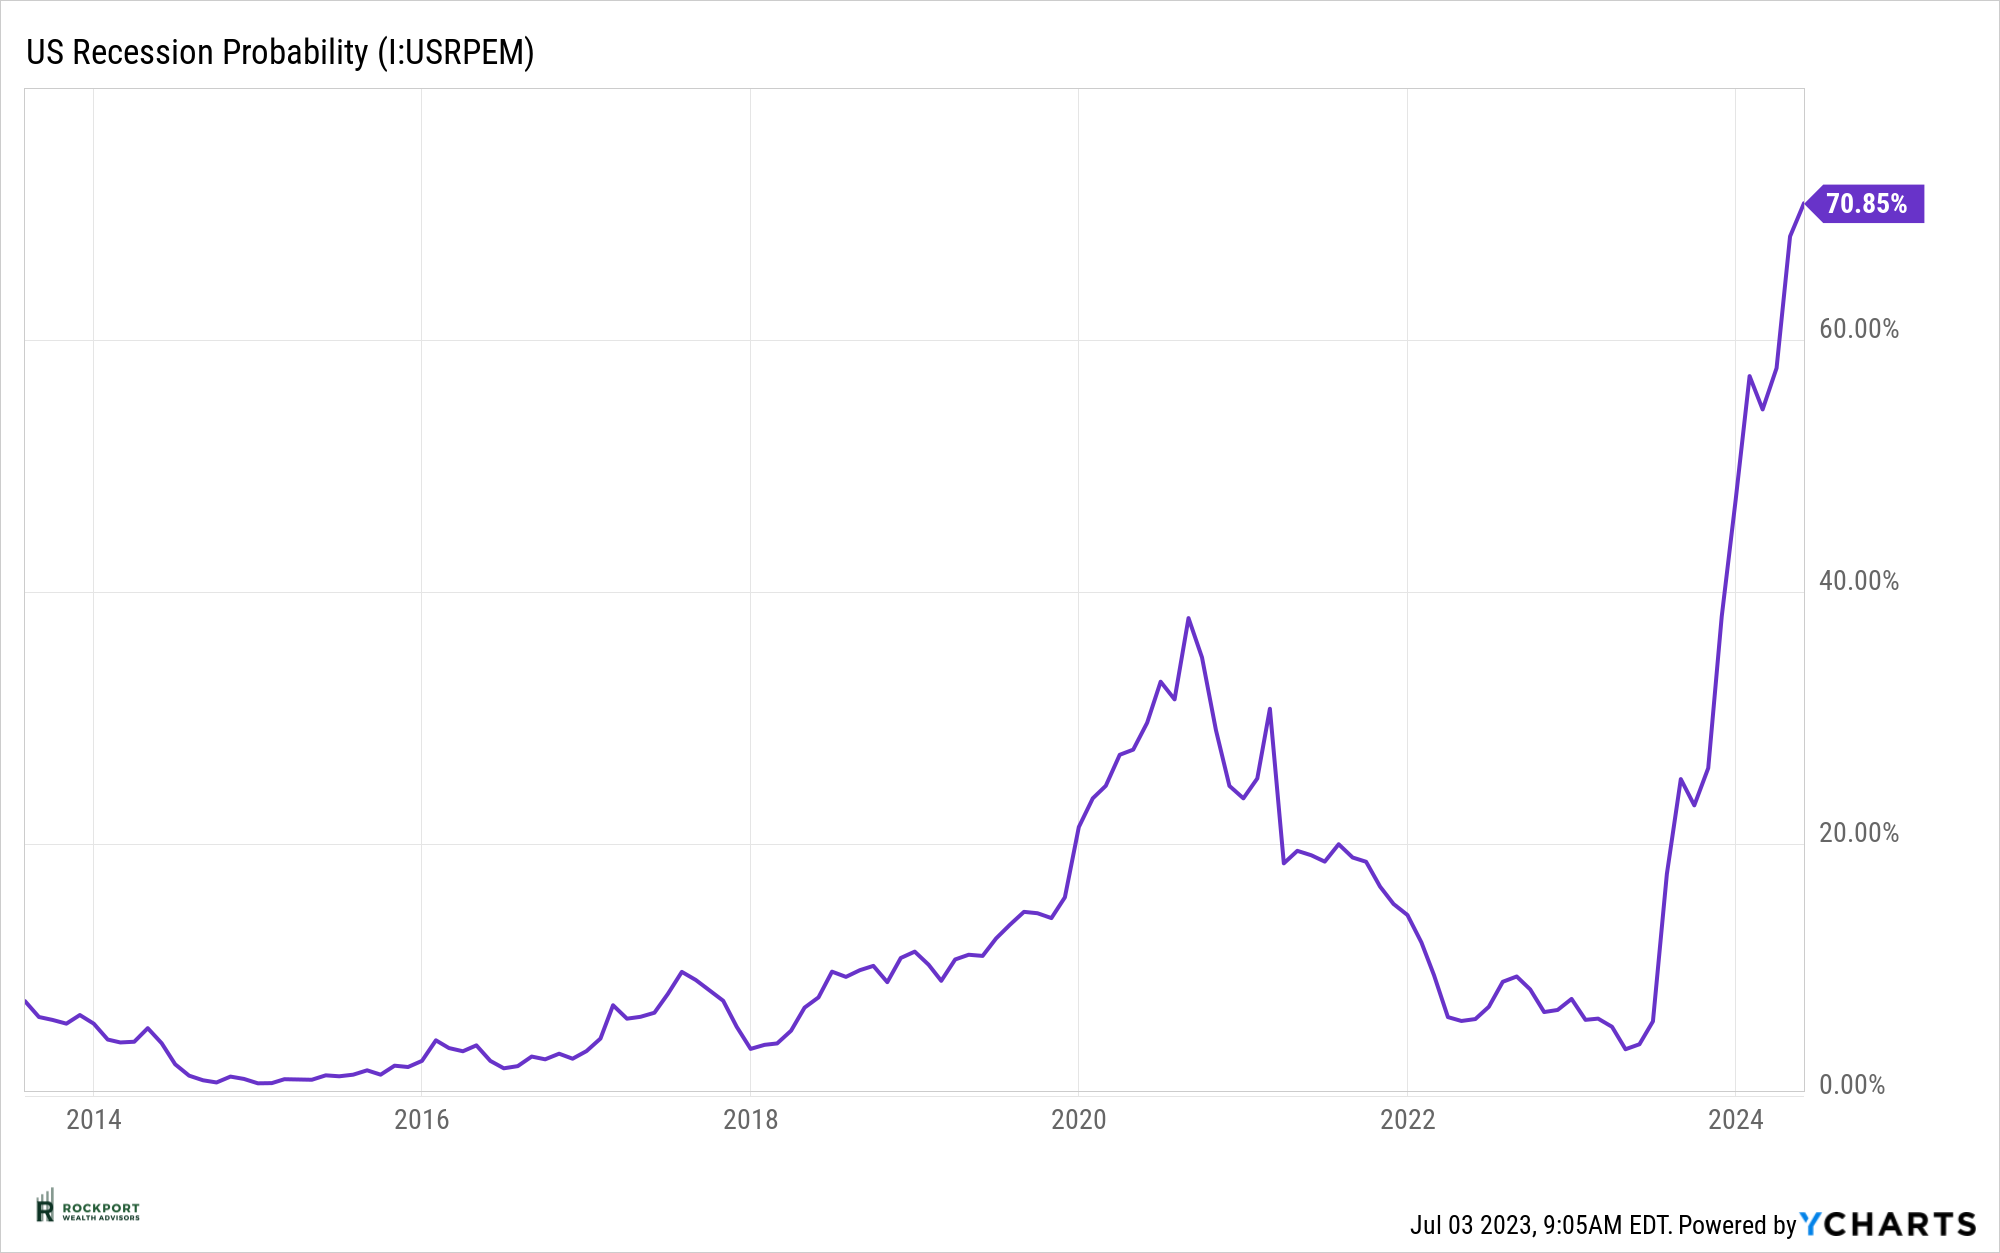
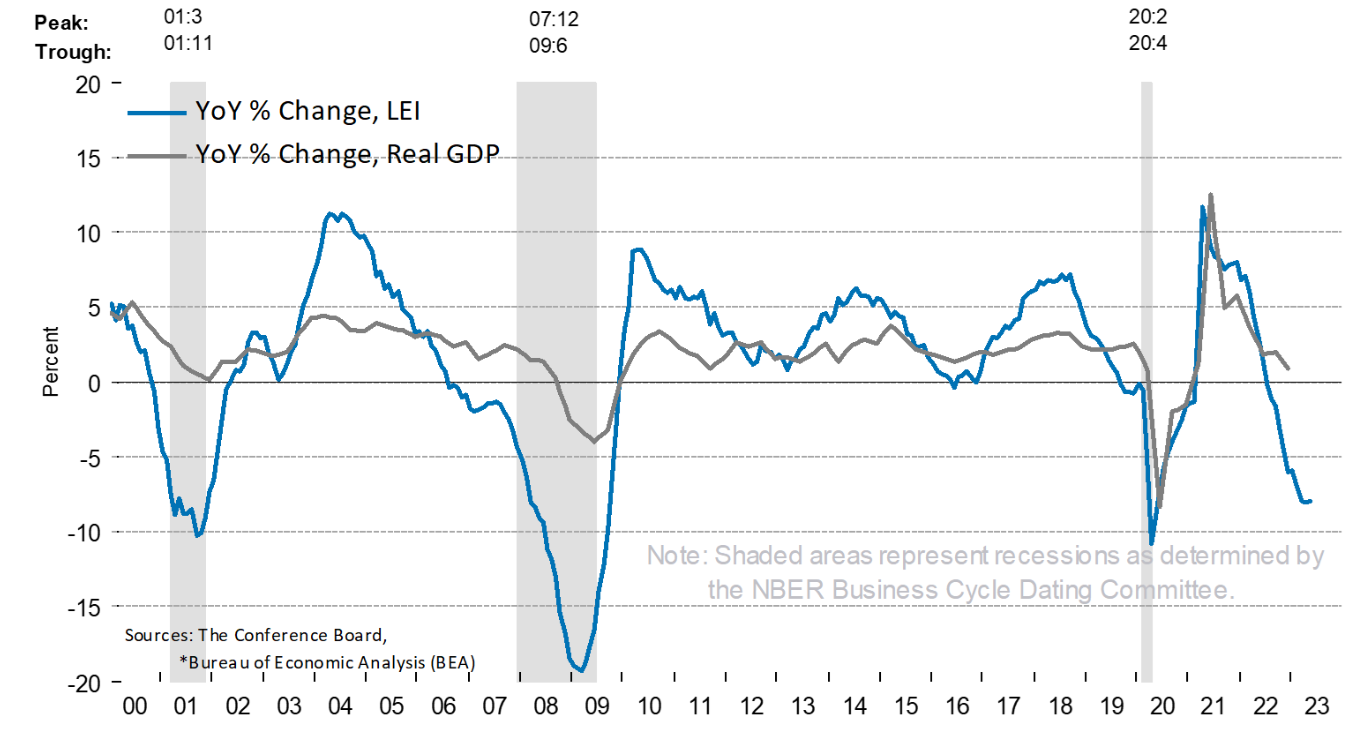
The Not So Good: Sticky CPI has fallen a bit, but it is still near its high at 6.15%. The New York Feds recession probability model has continued to increase. The LEI (Leading Economic Index) has declined for 14 straight months. The yield curve is and has been inverted. (Explained in Industry Topics below) Stock market valuations are not cheap, bond yields are rising, and lastly corporate profits are trending down.
The lists above are by no means all-inclusive but it is noticeable that the not so good far out numbers the good at the moment. Hence our defensive tone; call us skeptical if you will. Many times markets seem to defy all logic and this is clearly one of those times. Looking back, we can’t recall a time when so many indicators with tremendous track records of predicting recession were flashing yellow and red. The wild card for us continues to be employment so we are watching that closely. If that begins to falter, then it would appear a recession would be imminent. As for now things are a giant Grey Zone and things could go either way.
Rockport Models
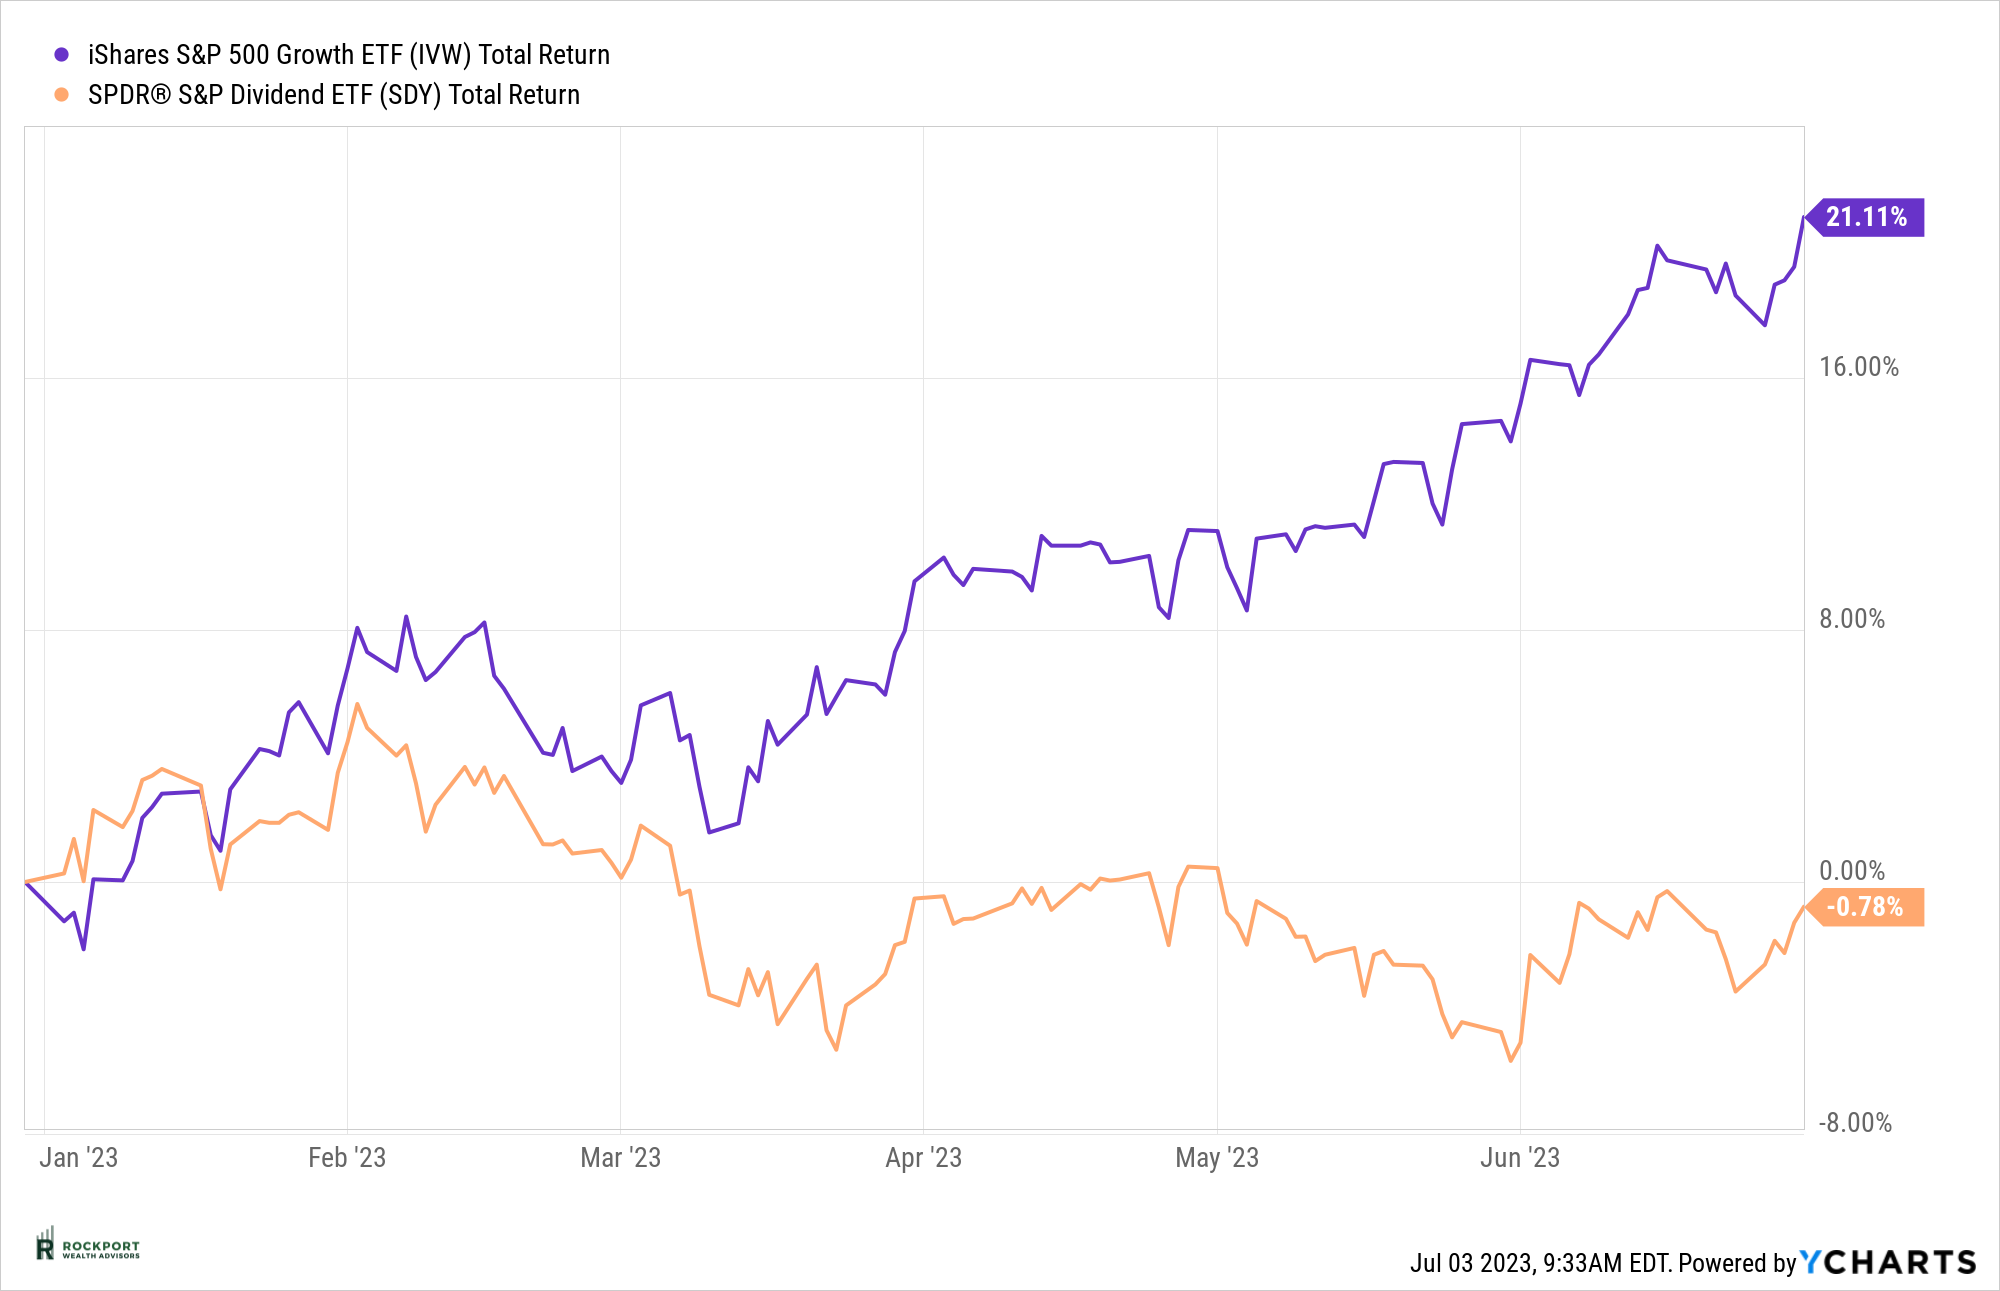
No changes were made to the Rockport models during the month of June. We are staying more defensive. Hence performance for the first half of the year had our Moderate models in the 5.5% range and our most active Sector model defensively positioned with returns in the 2.5% range. As stated above, while things did broaden out a bit during the month, a well-diversified portfolio lagged the S&P 500 noticeably. See the Chart below that shows the I Shares Growth ETF vs the SPDR S&P Dividend ETF year to date. This further backs up the case of the large spread between growth stocks and value stocks. We cannot recall a time when the spread was this wide.
Industry Topics
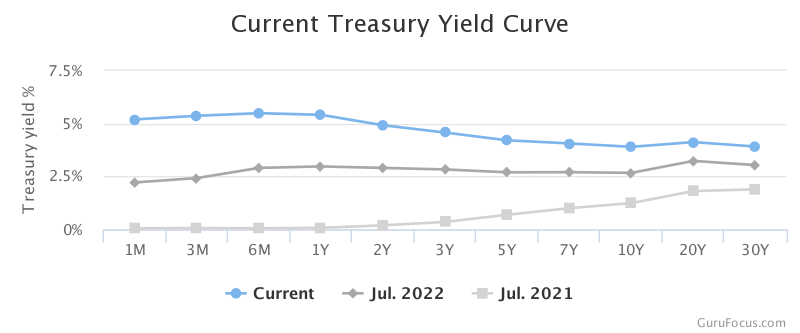
What is an inverted yield curve?
This has undoubtedly been a term you have heard or read about in the past 6-12 months. An inverted yield curve refers to a situation in the bond market where yields on shorter term bonds are higher than yields on longer term bonds. For example, as of the time of this writing a 6-month Treasury Bond was yielding 5.44% while the 10-year Treasury Bond was yielding 3.8%. This inversion is considered unusual and often raises concerns about the state of the economy as it has been a reliable predictor of economic recessions in the past. It suggests that investors are expecting lower interest rates in the future due to a weakening economy, leading them to seek the safety of longer term bonds. This increased demand for longer term bonds pushes their prices up and their yields down, hence the inversion. This is why we and other financial institutions keep a close eye on it.
Rockport News
Mark your calendars!
Our 3rd Annual Salute to Service Golf Outing which benefits several Veteran Organizations is scheduled for Monday August 14th. Once again it will be held at Red Tail Golf Club in the Cleveland Area. Details on participating or donating can be found at Salutetoservicegolf.com. It would be great to see as many clients and friends of Rockport attend as possible.
As always, if you have any questions on anything we have talked about here or anything else that is on your mind, please feel free to reach out.
*The Standard & Poor’s 500 (S&P 500) is an unmanaged group of securities considered to be representative of the stock market in general. Results can be found at slickcharts.com.
*Treasury yields can be found at finance.yahoo.com.
*Charts produced at yCharts.com
*Bonds can be found at bloomberg.com/markets/rates-bonds
*Fed Rate Probability Chart can be found at cmegroup.com/markets/interest-rates/cme-fedwatch-too
*The LEI can be found at conference-board.org/topics/us-leading-indicators
*Treasury Yield Curve can be found at Gurufocus.com