
Happy Holidays!
Markets & Economy
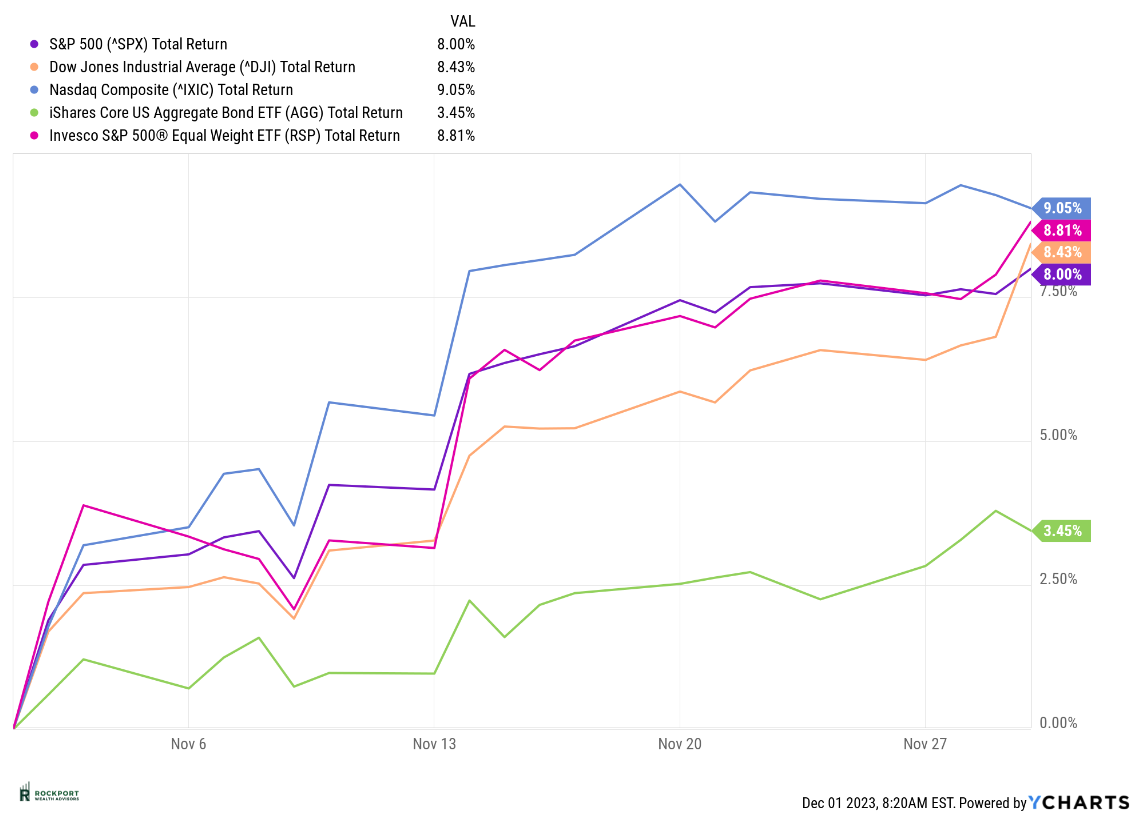
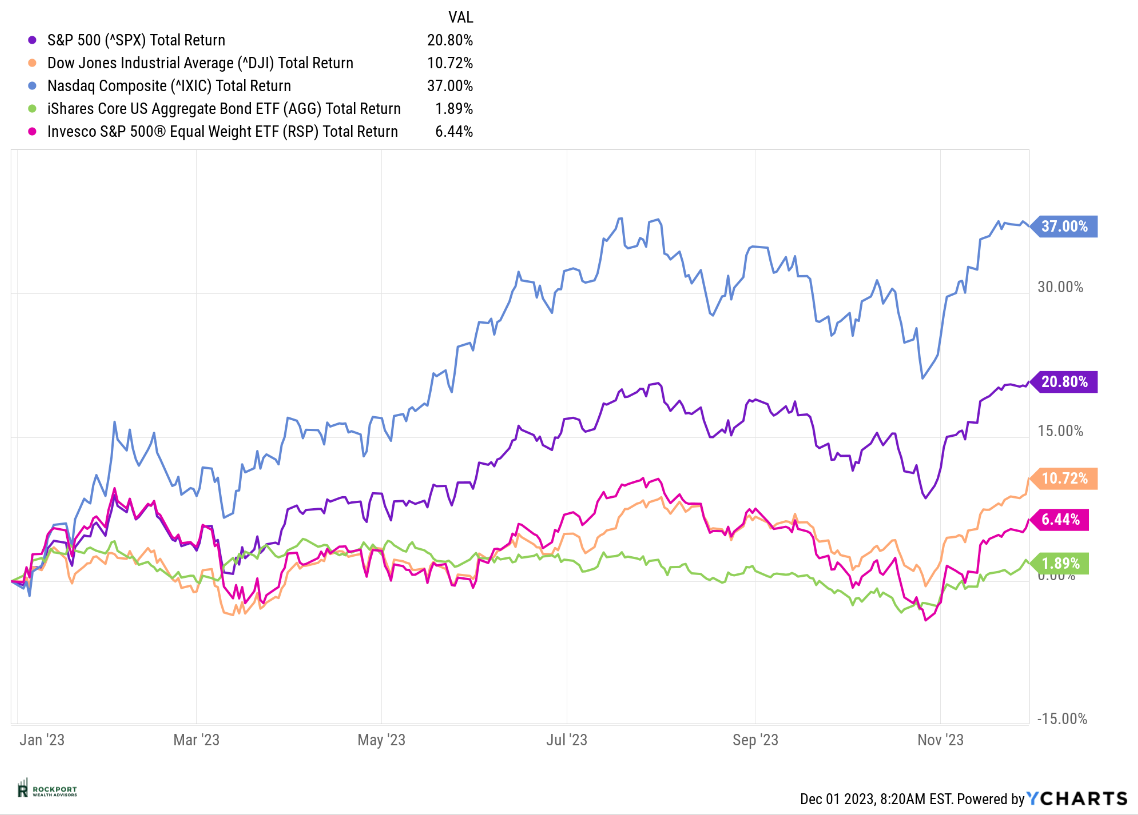
Following three consecutive months of declines, the markets experienced a remarkable turnaround, resulting in one of the most impressive Novembers on record. It’s always uplifting to share positive news. The S&P 500 surged by 8% for the month, bringing its year-to-date performance to a positive 20.8%, successfully recovering from the setbacks in August, September, and October.
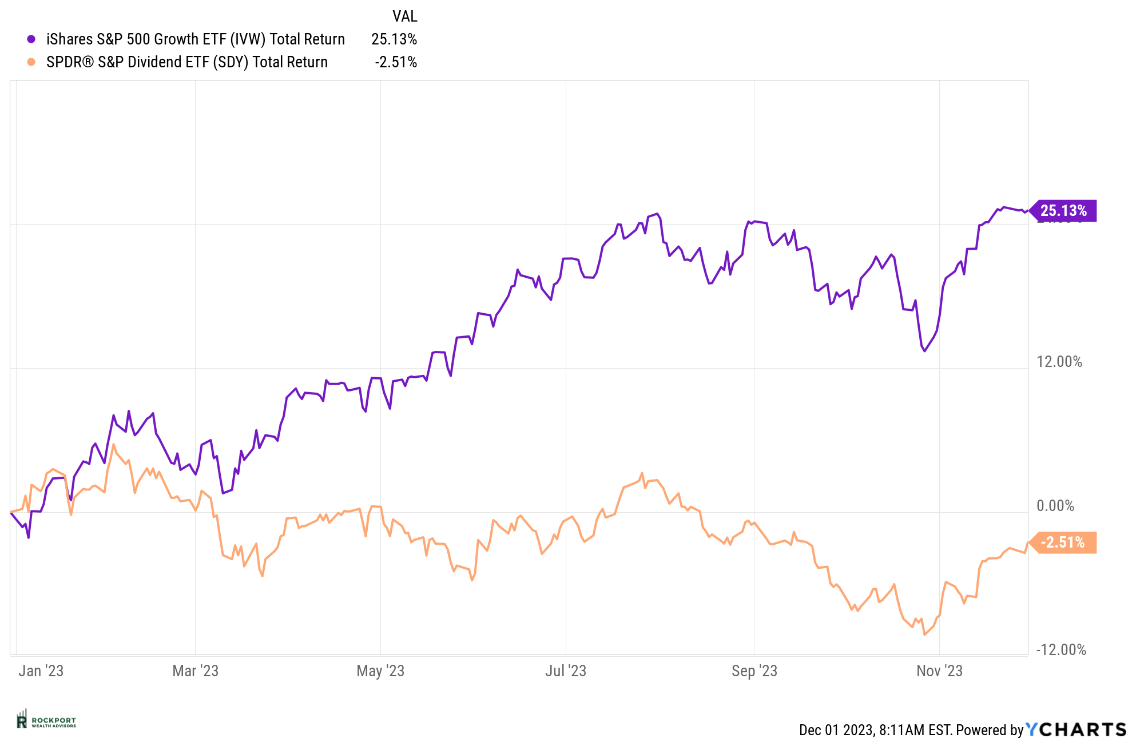
The month’s gains were well-distributed across nearly all asset classes, marking a departure from the recent trend. Even the S&P 500 equal weight exhibited a notable increase of 8.81%. Despite this stellar performance, certain anomalies persist, contributing to the unusual market dynamics of this year. Notably, the significant gap between Growth and Value stocks remains extraordinary, and the S&P 500 Equal Weight continues to significantly lag behind its weighted counterpart, attributed to the remarkable outperformance of the magnificent seven.
This divergence in performance, reminiscent of the year 2000, historically signals potential concerns for a healthy stock market. The hope is for a more balanced participation from all stocks in the months ahead, working towards narrowing these spreads.
Wondering why the market soared in November? Here’s a simple breakdown. Right now, momentum is the driving force, meaning the computers on Wall Street accentuate whatever trend is in play, whether it’s up or down. Things happen fast these days, and there’s a renewed buzz around FOMO (Fear of Missing Out). Another factor is the market’s expectation of interest rate cuts by the Federal Reserve. Our CME FedWatch Tool, introduced in the last newsletter, currently suggests a 14% probability of a rate cut as early as January. We think it’s too early to consider rate cuts, and if they don’t happen as expected, it could disappoint the markets in the first quarter of next year. Additionally, it’s worth noting that historically, the start of rate cuts hasn’t been as positive as the media portrays it.
Despite the positive atmosphere and optimistic sentiments of the past month, our focus remains on monitoring the possibility of a recession. The Federal Reserve seems to have paused interest rate hikes for now, which could be a favorable development. However, as we’ve highlighted before, there is a time lag between rate increases and their actual impact on the economy. We find ourselves in the midst of that period currently, and it is expected to extend over the next few months.
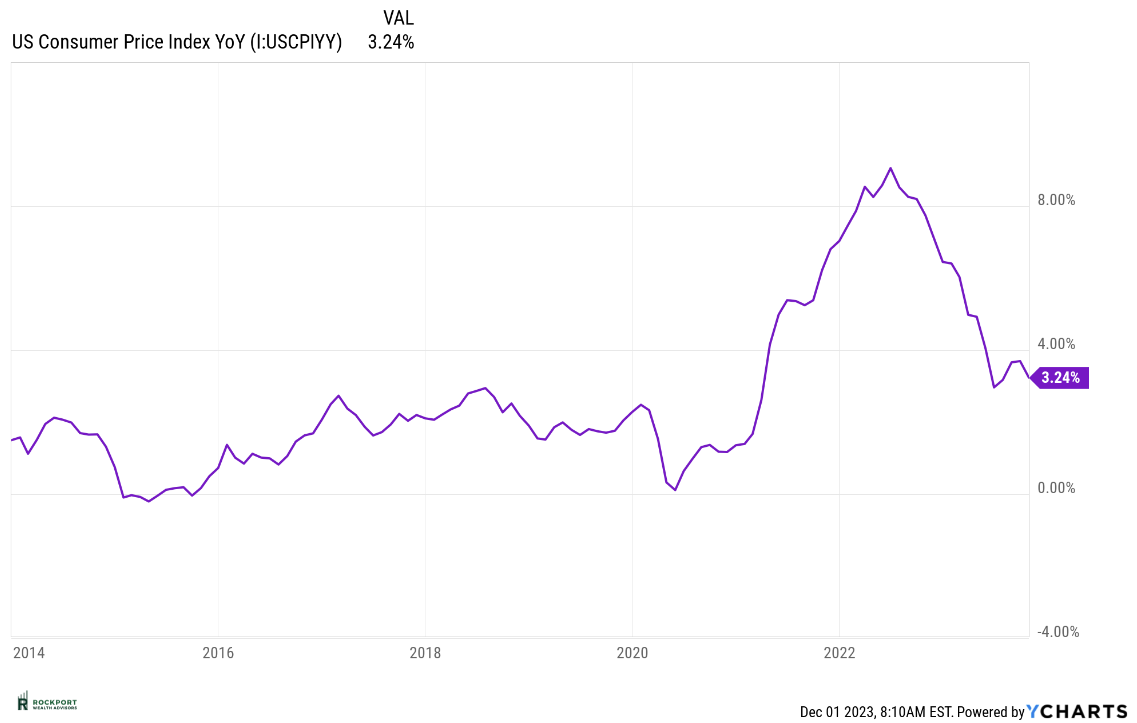
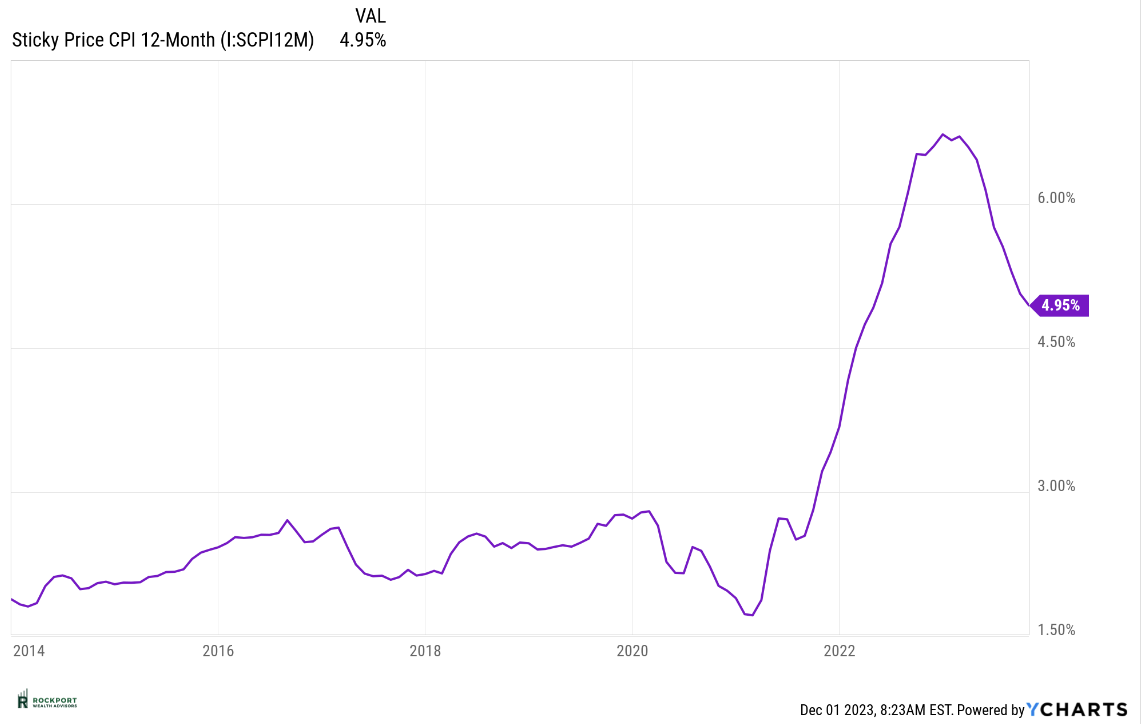
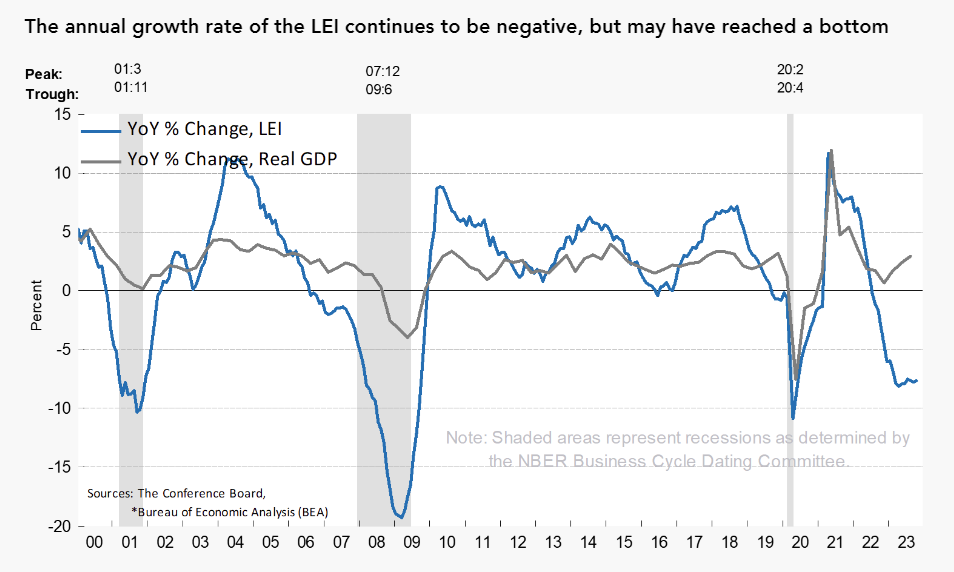
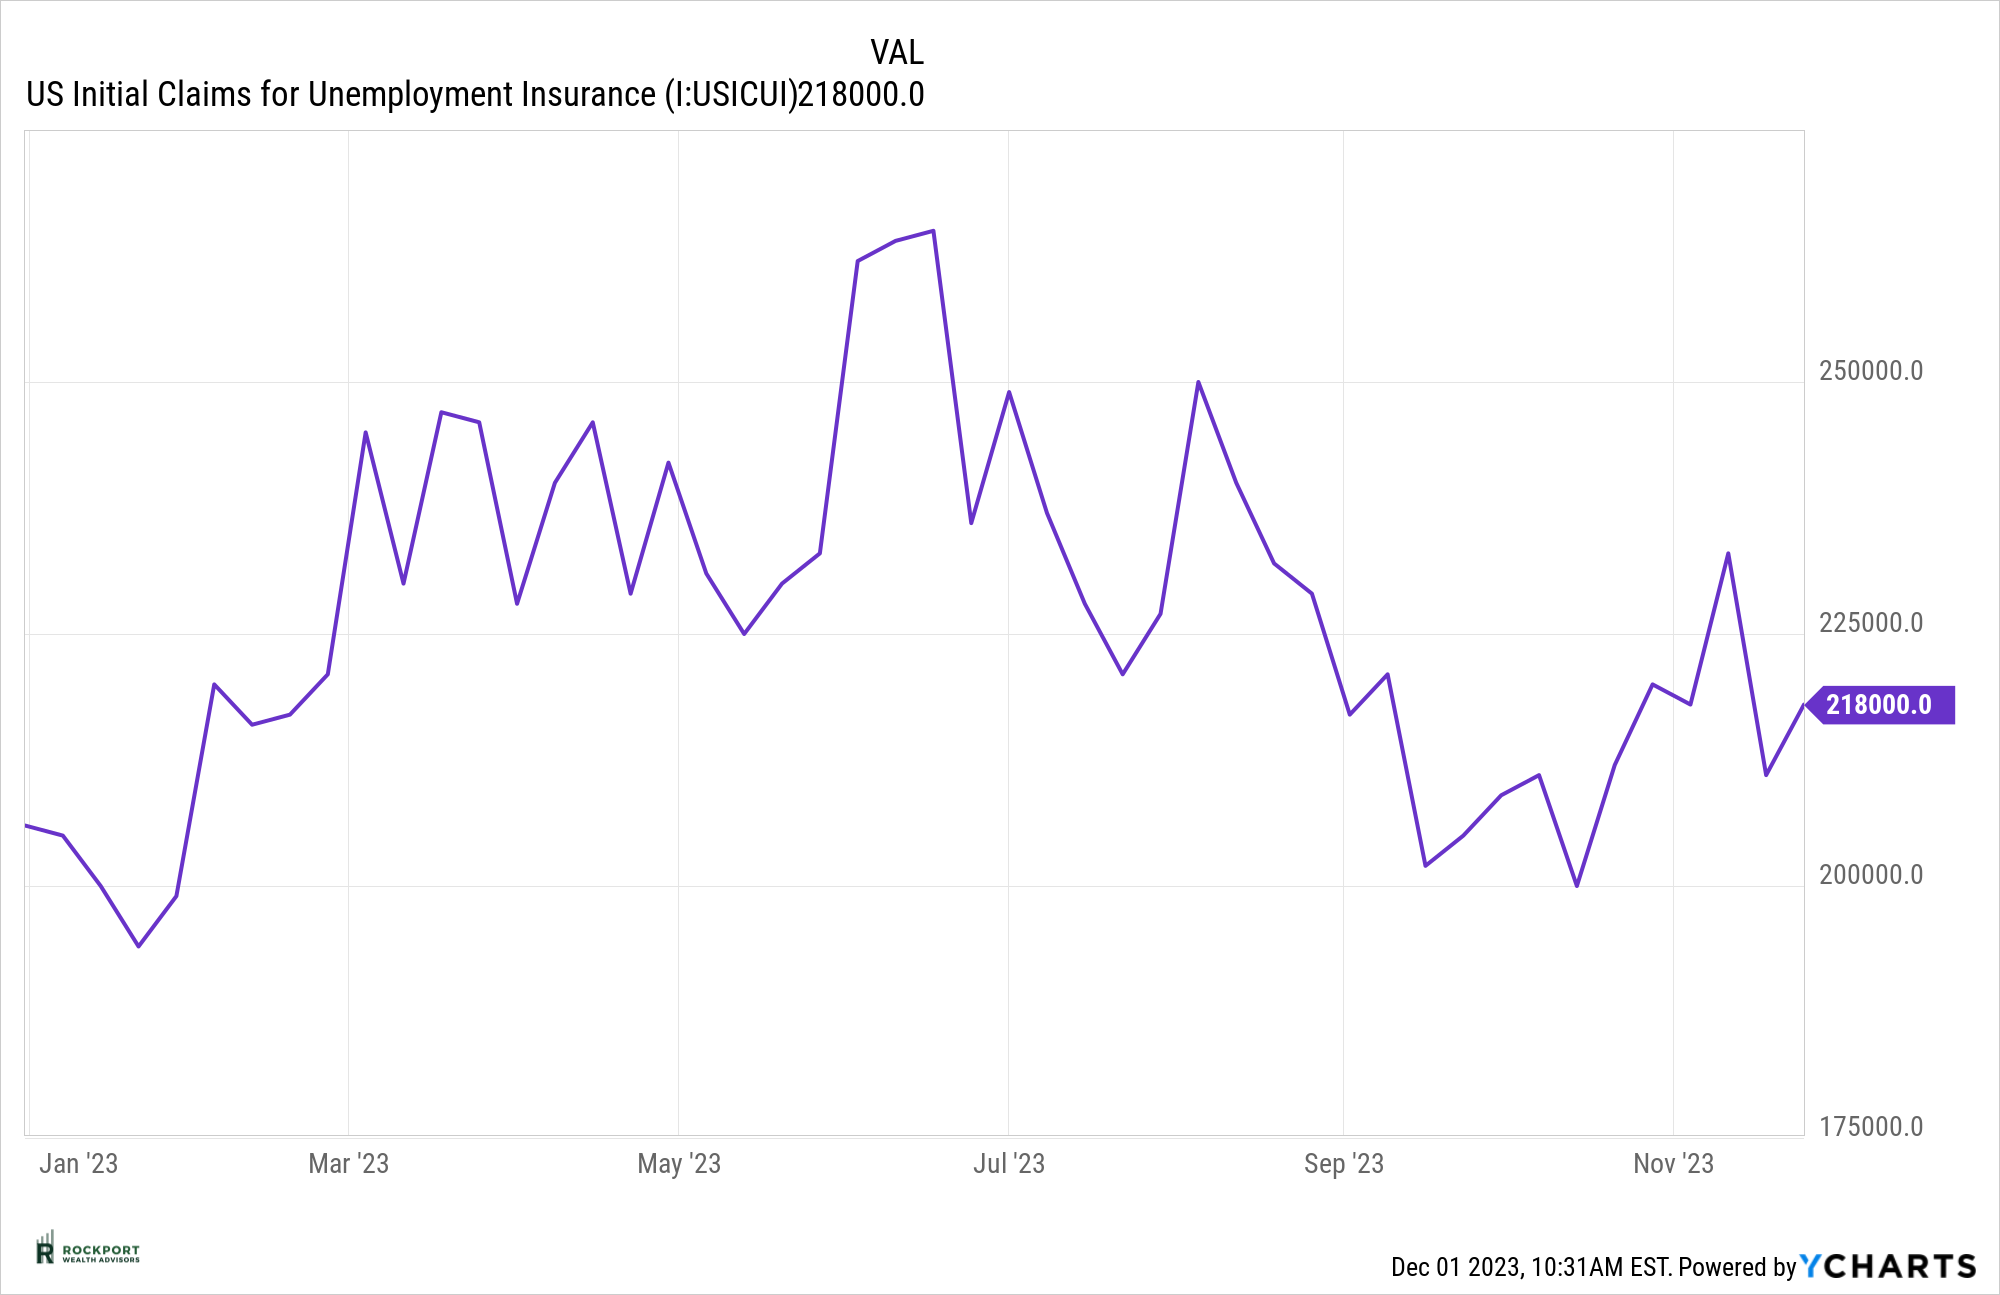
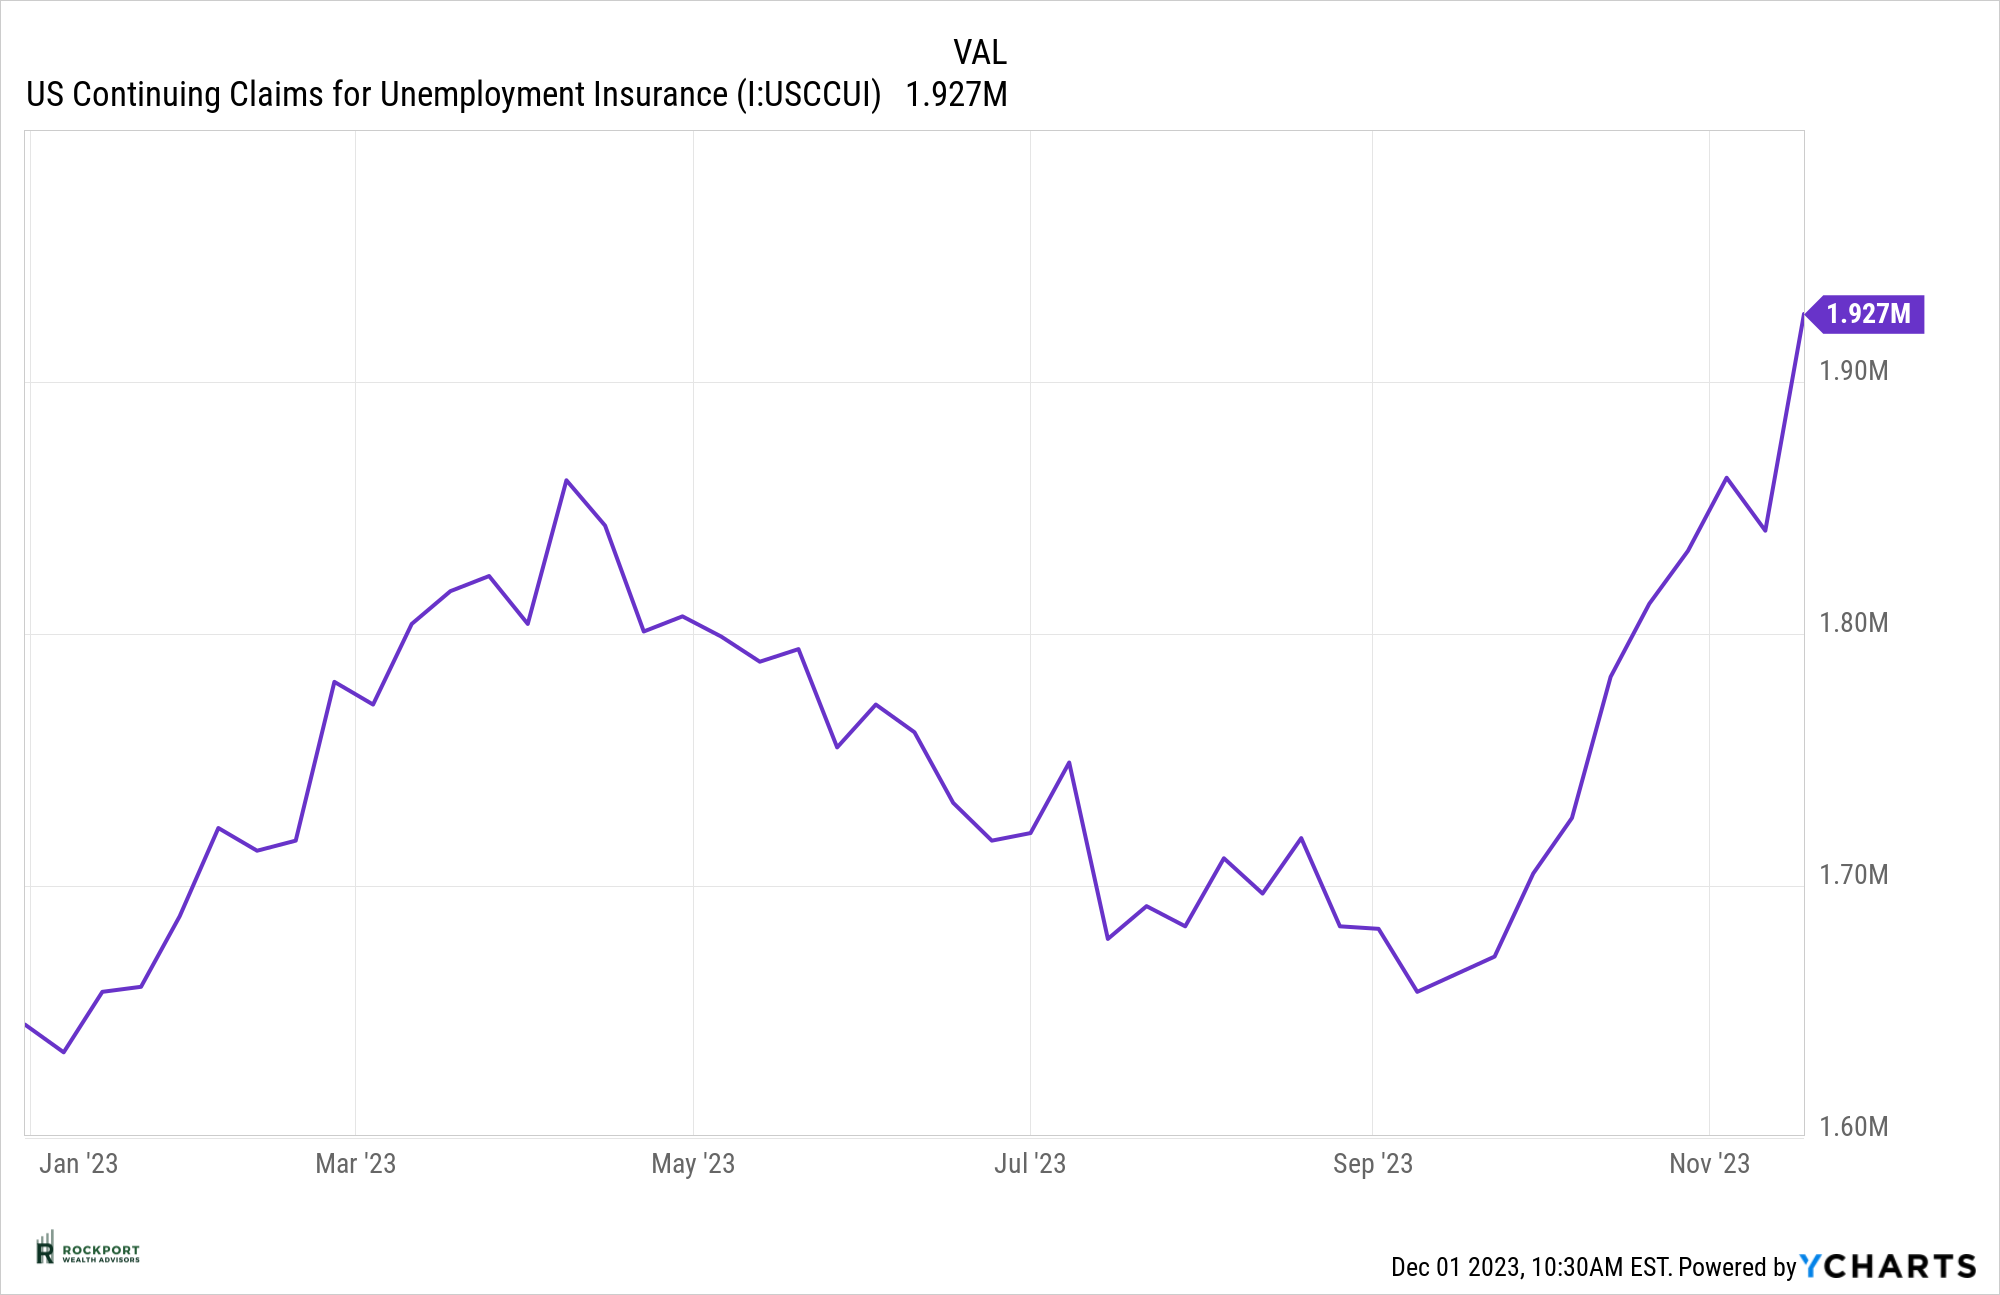
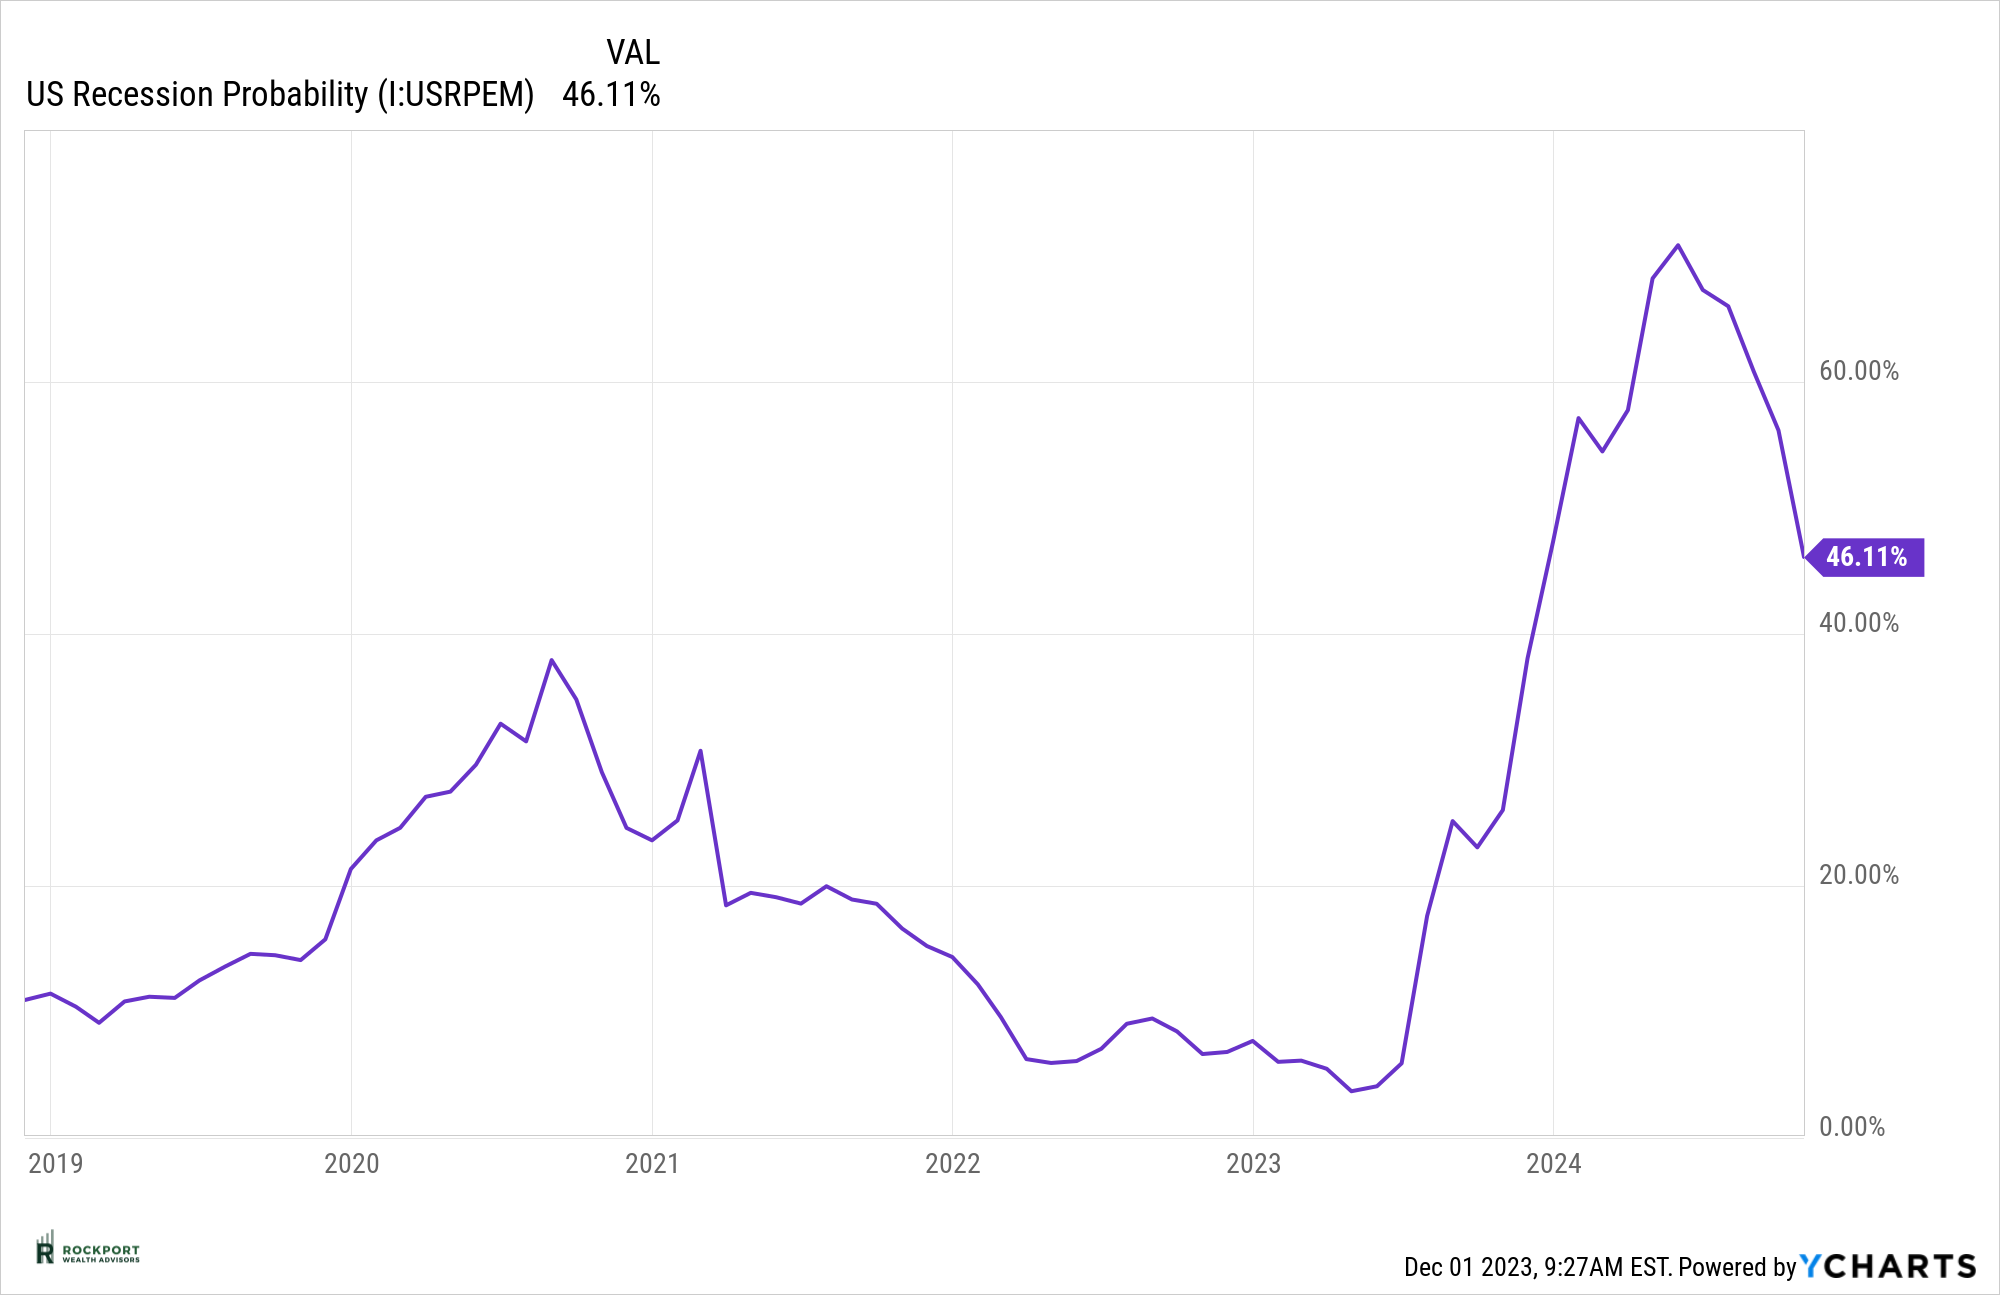
While inflation is gradually decreasing, it persists above the Federal Reserve’s target of 2%. The leading economic index has recorded its 19th consecutive monthly decline, a pattern previously observed only during the Great Recession of 2008. Additionally, there are concerns about weakening consumer and employment scenarios. Consumer spending seems to be decelerating, and there’s a rise in credit card balances and delinquencies. Although initial unemployment claims remain at a reasonable level, continuing claims have started to climb, indicating increased difficulty for those seeking employment. We will be closely monitoring these developments in the upcoming months and providing updates through our newsletters. According to the recession probability model, the likelihood of a recession remains high, with the highest probability predicted to materialize in April of next year.
Considering everything mentioned, it wouldn’t be too surprising if the markets ended the year on a higher note than they did in November. December typically shows positive trends. As we close out this year and enter 2024, it’s worth keeping an eye on how the Federal Reserve manages interest rates. If they cut rates too quickly, there’s a risk of inflation making a strong comeback. On the other hand, if they delay the cuts too much, there’s a possibility of a significant economic downturn. Clearly, the Federal Reserve is facing a challenging situation, especially if they have completed their series of rate hikes.
Rockport Models
On November 16th we made a change to our sector model (our most active) by increasing NOBL (Proshares S&P 500 Dividend Aristocrats) from 8 to 12% and decreasing cash/money market accordingly. This ETF is a dividend aristocrat ETF which consists of high-quality companies that have paid dividends for at least 25 years, and at this time presents tremendous value vs growth stocks.
In addition, starting in 2024 changes will be communicated by group to the respective model you are in via email. When changes are made to your respective model you will receive an email stating the change (s) within a short period of time after it occurs. Our goal is to step up communication on our thoughts and changes in a timelier manner.
Industry Topics
Spotlight on the Housing Market
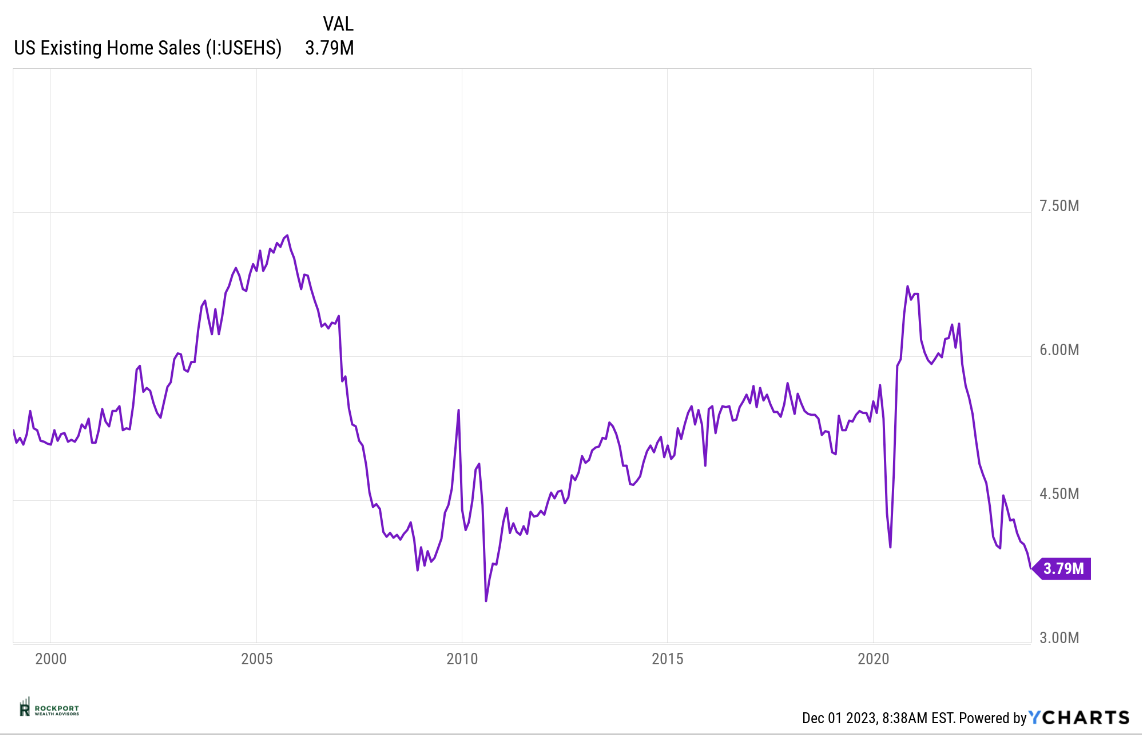
You’re likely aware that the housing market has been on an upswing for several years. Unfortunately, this has led to home prices reaching levels that are too high for many people. Just two years ago, 30-year mortgage rates were at 3.5% or lower, but now they’ve risen to over 7.5%. There are signs that the market might finally be slowing down. The chart below shows that US Existing Home Sales have dropped to levels not seen since 2011. Typically, when this happens, home prices tend to go down, and that’s exactly what’s occurring now. It’s important to understand that the real estate market moves more slowly than stocks or bonds, so these adjustments take time. However, if you’re in the market to buy a home, exercising patience might pay off, as more favorable pricing could be on the horizon.
As always, if you have any questions on anything we have talked about here or anything else that is on your mind, please feel free to reach out.
*The Standard & Poor’s 500 (S&P 500) is an unmanaged group of securities considered to be representative of the stock market in general. Results can be found at slickcharts.com.
*Treasury yields can be found at finance.yahoo.com.
*Charts produced at yCharts.com
*Bonds can be found at bloomberg.com/markets/rates-bonds
*Fed Rate Probability Chart can be found at cmegroup.com/markets/interest-rates/cme-fedwatch-too
*The LEI can be found at conference-board.org/topics/us-leading-indicators
*Treasury Yield Curve can be found at Gurufocus.com
*Rockport Models – Please remember we are referencing our model portfolios, and your portfolio may differ from the models mentioned depending on your individual needs and circumstance.